
Page 459 - IJB-9-5
P. 459
International Journal of Bioprinting 3D-printed oblique lumbar interbody cage
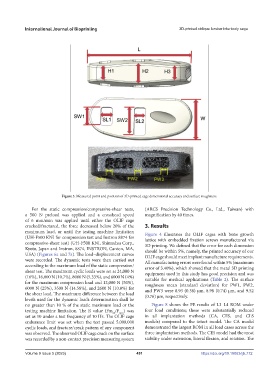
Figure 5. Measured point and position of 3D-printed cage dimensional accuracy and surface roughness.
For the static compression/compressive-shear tests, (ARCS Precision Technology Co., Ltd., Taiwan) with
a 500 N preload was applied and a crosshead speed magnification by 40 times.
of 6 mm/min was applied until either the OLIF cage
cracked/fractured, the force decreased below 20% of the 3. Results
maximum load, or until the testing machine limitation Figure 4 illustrates the OLIF cages with bone growth
(UH-F500 KNI for compression test and Instron 8874 for lattice with embedded fixation screws manufactured via
compressive-shear test) (UH-F500 KNI, Shimadzu Corp., 3D printing. We defined that the error for each dimension
Kyoto, Japan and Instron, 8874, INSTRON, Canton, MA, should be within 5%, namely, the printed accuracy of our
USA) (Figures 6a and 7a). The load–displacement curves OLIF cage should meet implant manufacture requirements.
were recorded. The dynamic tests were then carried out All manufacturing errors were found within 5% (maximum
according to the maximum load of the static compression/ error of 3.40%), which showed that the metal 3D printing
shear test. The maximum cyclic loads were set at 24,000 N equipment used in this study has good precision and was
(16%), 16,000 N (10.7%), 8000 N (5.33%), and 6000 N (4%) suitable for medical applications (Table 2). The surface
for the maximum compression load and 12,000 N (50%), roughness mean (standard deviation) for PW1, PW2,
6000 N (25%), 3500 N (14.58%), and 2600 N (10.8%) for and PW3 were 8.93 (0.38) µm, 8.98 (0.74) µm, and 9.52
the shear load. The maximum difference between the load (0.76) µm, respectively.
levels used for the dynamic loads determination shall be
no greater than 10 % of the static maximum load or the Figure 8 shows the FE results of L3–L4 ROM under
testing machine limitation. The R value (Fm /F ) was four load conditions; these were substantially reduced
min
ax
set as 10 under a test frequency of 10 Hz. The OLIF cage in all implantation methods (CA, CES, and CLS
endurance limit was set when the test passed 5,000,000 models) compared to the intact model. The CA model
cyclic loads, and fracture/creak pattern of any component demonstrated the largest ROM in all load cases across the
was observed. The observed OLIF cage crack on the surface three implantation methods. The CES model had the most
was recorded by a non-contact precision measuring system stability under extension, lateral flexion, and rotation. The
Volume 9 Issue 5 (2023) 451 https://doi.org/10.18063/ijb.772