
Page 461 - IJB-9-5
P. 461
International Journal of Bioprinting 3D-printed oblique lumbar interbody cage
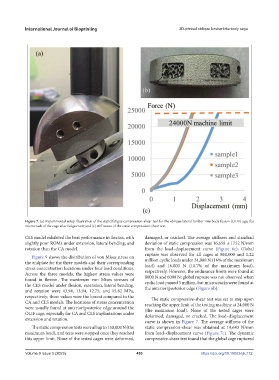
Figure 7. (a) Experimental setup illustration of the static/fatigue compression-shear test for the oblique lateral lumbar interbody fusion (OLIF) age; (b)
microcrack of the cage after fatigue test; and (c) stiffnesses of the static compression-shear test.
CLS model exhibited the best performance in flexion, with damaged, or cracked. The average stiffness and standard
slightly poor ROMs under extension, lateral bending, and deviation of static compression was 16,658 ± 1752 N/mm
rotation than the CA model. from the load–displacement curve (Figure 6c). Global
rupture was observed for all cages at 860,000 and 1.22
Figure 9 shows the distribution of von Mises stress on
the endplate for the three models and their corresponding million cyclic loads under 24,000 N (16% of the maximum
stress concentration locations under four load conditions. load) and 16,000 N (10.7% of the maximum load),
Across the three models, the highest stress values were respectively. However, the endurance limits were found at
found in flexion. The maximum von Mises stresses of 8000 N and 6000 N; global rupture was not observed when
the CES model under flexion, extension, lateral bending, cyclic load passed 5 million, but microcracks were found at
and rotation were 43.94, 13.94, 12.75, and 15.82 MPa, the anterior/posterior edge (Figure 6b).
respectively; these values were the lowest compared to the The static compressive-shear test was set to stop upon
CA and CLS models. The locations of stress concentration reaching the upper limit of the testing machine at 24,000 N
were usually found at anterior/posterior edge around the (the maximum load). None of the tested cages were
OLIF cage, especially for CA and CLS implantations under deformed, damaged, or cracked. The load–displacement
extension and rotation.
curve is shown in Figure 7. The average stiffness of the
The static compression tests were all up to 150,000 N (the static compression-shear was obtained at 19,643 N/mm
maximum load), and tests were stopped once they reached from load–displacement curve (Figure 7c). The dynamic
this upper limit. None of the tested cages were deformed, compressive-shear test found that the global cage ruptured
Volume 9 Issue 5 (2023) 453 https://doi.org/10.18063/ijb.772