
Page 326 - IJB-9-6
P. 326
International Journal of Bioprinting Rheology-informed machine learning model
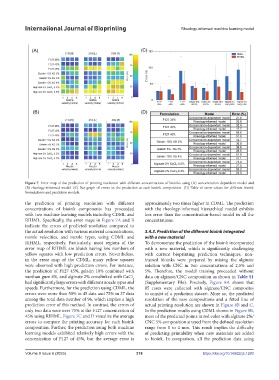
Figure 7. Error map of the prediction of printing resolution with different concentrations of bioinks using (A) concentration-dependent model and
(B) rheology-informed model. (C) Bar graph of errors in the prediction at each bioink composition. (D) Table of error values for different bioink
formulations and prediction models.
the prediction of printing resolution with different approximately two times higher in CDML. The prediction
concentrations of bioink components has proceeded with the rheology-informed hierarchical model exhibits
with two machine learning models including CDML and less error than the concentration-based model in all the
RIHML. Specifically, the error maps in Figure 7A and B concentrations.
indicate the errors of predicted resolution compared to
the actual resolution with various material concentrations, 3.4.3. Prediction of the different bioink integrated
nozzle velocities, and nozzle types, using CDML and with a new material
RIHML, respectively. Particularly, most regions of the To demonstrate the prediction of the bioink incorporated
error map of RIHML are bluish having low numbers of with a new material, which is significantly challenging
yellow squares with low prediction errors. Nevertheless, with current bioprinting prediction techniques, non-
in the error map of the CDML, many yellow squares trained bioinks were prepared by mixing the alginate
were observed with high prediction errors. For instance, solution with CNC in two concentrations of 2.5% and
the prediction of F127 45%, gelatin 10% combined with 5%. Therefore, the model training proceeded without
xanthan gum 4%, and alginate 2% crosslinked with CaCl data on alginate/CNC composition as shown in Table S1
2
had significantly large errors with different nozzle types and (Supplementary File). Precisely, Figure 8A shows that
speeds. Furthermore, for the prediction using CDML, the 85 cases were collected with alginate/CNC composites
errors were more than 50% in 45 data and 75% in 27 data to consist of a prediction dataset. More so, the predicted
among the total data number of 96, which implies a high resolution of the new compositions and a fitted line of
prediction error of this method. In contrast, the errors of actual printing resolution are shown in Figure 8B and C.
only two data were over 75% at the F127 concentration of In the prediction results using CDML shown in Figure 8B,
45% using RIHML. Figure 7C and D visualize the average most of the predicted points in red color with alginate 2%/
errors to compare the printing accuracy for each bioink CNC 5% composition strayed from the defined resolution
composition. Further, the prediction using both machine range from 0 to 4 mm. This result implies the difficulty
learning models exhibited relatively high errors with the of predicting printability when new materials are added
concentration of F127 of 45%, but the average error is to bioink. In comparison, all the prediction data using
Volume 9 Issue 6 (2023) 318 https://doi.org/10.36922/ijb.1280