
Page 374 - IJB-9-6
P. 374
International Journal of Bioprinting Aflatoxin B1-induced cancer stem cells
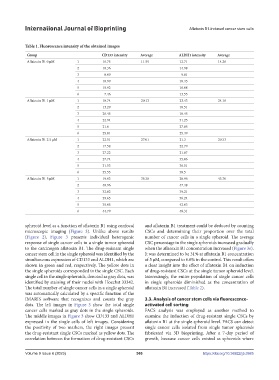
Table 1. Fluorescence intensity of the obtained images
Group CD133 intensity Average ALDH1 intensity Average
Aflatoxin B1 0 μM 1 16.75 11.59 12.71 14.26
2 10.36 14.98
3 8.09 9.81
4 10.99 18.43
5 15.92 16.08
6 7.46 13.55
Aflatoxin B1 1 μM 1 10.74 20.13 23.43 24.16
2 13.29 18.51
3 26.45 18.45
4 22.94 31.25
5 21.6 27.85
6 25.81 25.49
Aflatoxin B1 2.5 μM 1 22.51 27.01 21.3 29.33
2 17.58 22.79
3 27.22 21.87
4 27.74 35.06
5 31.53 36.51
6 35.53 38.5
Aflatoxin B1 5 μM 1 19.03 35.38 28.96 43.70
2 40.96 47.48
3 32.82 39.21
4 39.65 56.24
5 35.05 42.03
6 44.79 48.31
spheroid level as a function of aflatoxin B1 using confocal and aflatoxin B1 treatment could be deduced by counting
microscopic imaging (Figure 3). Unlike above results CSCs and determining their proportion over the total
(Figure 2), Figure 3 presents individual heterogenic number of cancer cells in a single spheroid. The average
response of single cancer cells in a single tumor spheroid CSC percentage in the single spheroids increased gradually
to the carcinogen aflatoxin B1. The drug-resistant single when the aflatoxin B1 concentration increased (Figure 3e).
cancer stem cell in the single spheroid was identified by the It was determined to be 31% at aflatoxin B1 concentration
simultaneous expression of CD133 and ALDH1, which are of 5 μM, compared to 6.6% in the control. This result offers
shown in green and red, respectively. The yellow dots in a clear insight into the effect of aflatoxin B1 on induction
the single spheroids corresponded to the single CSC. Each of drug-resistant CSCs at the single tumor spheroid level.
single cell in the single spheroids, denoted as gray dots, was Interestingly, the entire population of single cancer cells
identified by staining of their nuclei with Hoechst 33342. in single spheroids diminished as the concentration of
The total number of single cancer cells in a single spheroid aflatoxin B1 increased (Table 2).
was automatically calculated by a specific function of the
IMARIS software that recognizes and counts the gray 3.3. Analysis of cancer stem cells via fluorescence-
dots. The left images in Figure 3 show the total single activated cell sorting
cancer cells marked as gray dots in the single spheroids. FACS analysis was employed as another method to
The middle images in Figure 3 show CD133 and ALDH1 examine the induction of drug-resistant single CSCs by
expressed in the single cells of left images. Considering aflatoxin B1 at the single spheroid level. FACS can detect
the positivity of two markers, the right images present single cancer cells isolated from single tumor spheroids
the drug-resistant single CSCs marked as yellow dots. The fabricated via 3D bioprinting. After a 7-day period of
correlation between the formation of drug-resistant CSCs growth, because cancer cells existed as spheroids where
Volume 9 Issue 6 (2023) 366 https://doi.org/10.36922/ijb.0985