
Page 375 - IJB-9-6
P. 375
International Journal of Bioprinting Aflatoxin B1-induced cancer stem cells
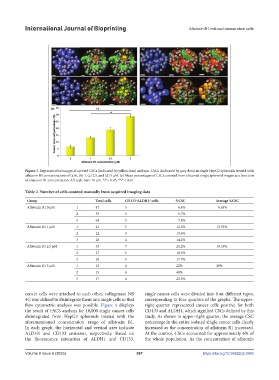
Figure 3. Representative images of spotted CSCs (indicated by yellow dots) and non-CSCs (indicated by gray dots) in single HepG2 spheroids treated with
aflatoxin B1 concentrations of (a) 0, (b) 1, (c) 2.5, and (d) 5 μM. (e) Mean percentages of CSCs counted from obtained single spheroid images as a function
of aflatoxin B1 concentration. All scale bars: 10 μm. *P < 0.05, **P < 0.01.
Table 2. Number of cells counted manually from acquired imaging data
Group Total cells CD133 ALDH1 cells %CSC Average %CSC
+
+
Aflatoxin B1 0 μM 1 47 3 6.4% 6.63%
2 53 3 5.7%
3 64 5 7.8%
Aflatoxin B1 1 μM 1 41 5 12.2% 13.33%
2 22 3 13.6%
3 28 4 14.2%
Aflatoxin B1 2.5 μM 1 33 7 21.2% 19.19%
2 27 5 18.5%
3 28 5 17.9%
Aflatoxin B1 5 μM 1 18 4 22% 29%
2 15 6 40%
3 17 4 23.5%
cancer cells were attached to each other, collagenase NB single cancer cells were divided into four different types,
4G was utilized to disintegrate them into single cells so that corresponding to four quarters of the graphs. The upper-
flow cytometric analysis was possible. Figure 4 displays right quarter represented cancer cells positive for both
the result of FACS analysis for 10,000 single cancer cells CD133 and ALDH1, which signified CSCs defined by this
disintegrated from HepG2 spheroids treated with the study. As shown in upper-right quarter, the average CSC
aforementioned concentration range of aflatoxin B1. percentage in the entire isolated single cancer cells clearly
In each graph, the horizontal and vertical axes indicate increased as the concentration of aflatoxin B1 increased.
ALDH1 and CD133 emission, respectively. Based on At the control, CSCs accounted for approximately 6% of
the fluorescence intensities of ALDH1 and CD133, the whole population. As the concentration of aflatoxin
Volume 9 Issue 6 (2023) 367 https://doi.org/10.36922/ijb.0985