
Page 462 - IJB-9-6
P. 462
International Journal of Bioprinting 3D bioprinting of in vitro cartilage tissue model
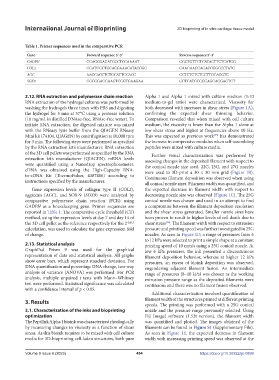
Table 1. Primer sequences used in the comparative PCR
Gene Forward sequence 5’-3’ Reverse sequence 5’-3’
GADPH GGAGCGAGATCCCTCCAAAAT GGCTGTTGTCATACTTCTCATGG
COL2 GGATGGCTGCACGAAACATACCGG CAAGAAGCAGACCGGCCCTATG
AGC AACCACCTCTGCATTCCACG CCTCTGTCTCCTTGCAGGTC
SOX9 GGCGGAGGAAGTCGGTGAAGAA GCTCATGCCGGAGGAGGAGTGT
2.12. RNA extraction and polymerase chain reaction Alpha 1 and Alpha 1 mixed with culture medium (1:10
RNA extraction of the hydrogel cultures was performed by medium-to-gel ratio) were characterized. Viscosity for
washing the hydrogels three times with PBS and digesting both decreased with increases in shear stress (Figure 1A),
the hydrogel for 5 min at 37°C using a protease solution confirming the expected shear thinning behavior.
(10 mg/mL in distilled DNAse-free, RNAse-free water). To Comparison revealed that when mixed with cell culture
initiate RNA extraction, the digested mixture was mixed medium, the viscosity is lower than the Alpha 1 alone at
with the RNeasy lysis buffer from the QIAGEN RNeasy low shear stress and higher at frequencies above 10 Hz.
Mini kit (74104, QIAGEN) by centrifugation at 10,000 rpm This was expected as previous work has demonstrated
[35]
for 3 min. The following steps were performed as specified the increase in compressive modulus when self-assembling
by the RNA extraction kit’s manufacturer. RNA extraction peptides were mixed with culture media.
of the 3D cell pellets was performed as specified by the RNA Further visual characterization was performed by
extraction kit’s manufacturer (QIAGEN). mRNA levels assessing changes in the deposited filament with respect to
were quantified using a Nanodrop spectrophotometer. the conical nozzle size used. 22G, 25G, and 27G nozzles
cDNA was obtained using the High-Capacity RNA- were used to 3D-print a 30 × 30 mm grid (Figure 1B).
to-cDNA Kit (ThermoFisher, 4387406) according to Continuous filament deposition was observed when using
instructions specified by the manufacturer.
all conical nozzle sizes. Filament width was quantified, and
Gene expression levels of collagen type II (COL2), the expected decrease in filament width with respect to
aggrecan (AGC), and SOX-9 (SOX9) were analyzed by decreasing nozzle size was observed (Figure 1C). The 25G
comparative polymerase chain reaction (PCR) using conical nozzle was chosen and used in an attempt to find
GADPH as a housekeeping gene. Primer sequences are a compromise between the filament deposition resolution
reported in Table 1. The comparative cycle threshold (CT) and the shear stress generated. Smaller nozzle sizes have
method, using the expression levels at day 7 and day 14 of been proven to result in higher levels of cell death due to
the 3D cell pellet as the reference respectively for the 2 -∆∆Ct shear stress . The filament width with respect to extrusion
[36]
calculation, was used to calculate the gene expression fold pressure and printing speed was further investigated in 25G
of change. nozzles. As seen in Figure 1D, a range of pressures from 6
to 12 kPa were selected to print a simple shape at a constant
2.13. Statistical analysis printing speed of 10 mm/s using a 25G conical nozzle. At
GraphPad Prism 9 was used for the graphical low 6 kPa pressures, the ink presented a discontinuous
representation of data and statistical analysis. All graphs filament deposition behavior, whereas at higher 12 kPa
show error bars, which represent standard deviation. For pressures, an excess of bioink deposition was observed,
DNA quantification and percentage DNA change, two-way engendering adjacent filament fusion. An intermediate
analysis of variance (ANOVA) was performed. For PCR range of pressures (8–10 kPa) was chosen as the working
analysis, multiple unpaired t tests with Mann–Whitney extrusion pressure range as the deposited filaments were
test were performed. Statistical significance was calculated continuous and there was no filament fusion observed.
with a confidence interval of p < 0.05.
Additional characterization involved quantification of
3. Results filament width of the structures printed at different printing
speeds. The printing was performed with a 25G conical
3.1. Characterization of the inks and bioprinting nozzle and the pressure range previously selected. Using
optimization Fiji ImageJ software (1.53t version), the filament width
The PeptiInk Alpha 1 bioink was characterized rheologically was quantified and plotted. The images obtained of the
by measuring changes in viscosity as a function of shear filaments can be found in Figure S1 (Supplementary File).
stress. As this bioink requires to be mixed with cell culture As seen in Figure 1E, the expected decrease in filament
media for 3D-bioprinting cell-laden structures, both pure width with increasing printing speed was observed at the
Volume 9 Issue 6 (2023) 454 https://doi.org/10.36922/ijb.0899