
Page 465 - IJB-9-6
P. 465
International Journal of Bioprinting 3D bioprinting of in vitro cartilage tissue model
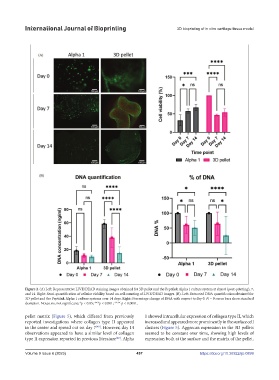
Figure 2. (A) Left: Representative LIVE/DEAD staining images obtained for 3D pellet and the PeptiInk Alpha 1 culture system at days 0 (post-printing), 7,
and 14. Right: Semi-quantification of cellular viability based on cell counting of LIVE/DEAD images. (B). Left: Extracted DNA quantification obtained for
3D pellet and the PeptiInk Alpha 1 culture systems over 14 days. Right: Percentage change of DNA with respect to day 0. N = 9; error bars show standard
deviation. Notes: ns, not significant; *p < 0.05; ***p < 0.001; **** p < 0.0001.
pellet matrix (Figure 5), which differed from previously 1 showed intracellular expression of collagen type II, which
reported investigations where collagen type II appeared increased and appeared more prominently in the surface cell
in the center and spread out on day 7 . However, day 14 clusters (Figure 5). Aggrecan expression in the 3D pellets
[40]
observations appeared to have a similar level of collagen seemed to be constant over time, showing high levels of
type II expression reported in previous literature . Alpha expression both at the surface and the matrix of the pellet.
[40]
Volume 9 Issue 6 (2023) 457 https://doi.org/10.36922/ijb.0899