
Page 469 - IJB-9-6
P. 469
International Journal of Bioprinting 3D bioprinting of in vitro cartilage tissue model
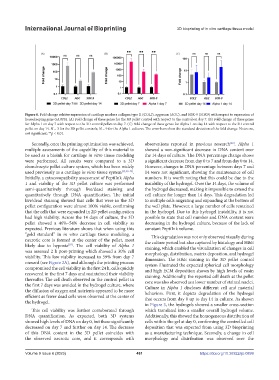
Figure 6. Fold change relative expression of cartilage markers collagen type II (COL2), aggrecan (AGC), and SOX-9 (SOX9) with respect to expression of
housekeeping gene GADPH. (A) Fold change of these genes for the 3D pellet control with respect to the control on day 7. (B) Fold change of these genes
for Alpha 1 on day 7 with respect to the 3D control pellet on day 7. (C) Fold change of these genes for Alpha 1 on day 14 with respect to the 3D control
pellet on day 14. N = 3 for the 3D pellet controls; N = 9 for the Alpha 1 cultures. The error bars show the standard deviation of the fold change. Notes: ns,
not significant; **p < 0.01.
Secondly, once the printing optimization was achieved, observations reported in previous research . Alpha 1
[40]
multiple assessments of the capability of this material to showed a non-significant decrease in DNA content over
be used as a bioink for cartilage in vitro tissue modeling the 14 days of culture. The DNA percentage change shows
were performed. All results were compared to a 3D a significant decrease from day 0 to 7 and from day 0 to 14.
chondrocyte pellet culture system, which has been widely However, changes in DNA percentage between days 7 and
used previously as a cartilage in vitro tissue system [33,40-43] . 14 were not significant, showing the maintenance of cell
Initially, a cytocompatibility assessment of PeptiInk Alpha numbers. It is worth noting that this could be due to the
1 and viability of the 3D pellet culture was performed instability of the hydrogel. Over the 14 days, the volume of
semi-quantitatively through live/dead staining and the hydrogel decreased, making it impossible to extend the
quantitatively through DNA quantification. The initial cell culture for longer than 14 days. This degradation led
live/dead staining showed that cells that were in the 3D to multiple cells migrating and expanding at the bottom of
pellet configuration were almost 100% viable, confirming the well plate. However, a large number of cells remained
that the cells that were expanded in 2D pellet configuration in the hydrogel. Due to this hydrogel instability, it is not
had high viability. Across the 14 days of culture, the 3D possible to state that cell number and DNA content were
pellet showed a 46%–54% decrease in cell viability as decreasing in the hydrogel culture, because of the lack of
expected. Previous literature shows that when using this constant PeptiInk volume.
“gold standard” in in vitro cartilage tissue modeling, a This degradation was not only observed visually during
necrotic core is formed at the center of the pellet, most the culture period but also captured by histology and H&E
likely due to hypoxia . The cell viability of Alpha 1 staining, which enabled the visualization of changes in cell
[37]
was assessed 2 h post-printing which showed a 30% cell morphology, distribution, matrix deposition, and hydrogel
viability. This low viability increased to 59% from day 7 dimension. The H&E staining in the 3D pellet control
onward (see Figure 2A), and although the printing process system illustrated the expected spherical cell morphology
compromised the cell viability in the first 24 h, cells quickly and high ECM deposition shown by high levels of eosin
recovered in the first 7 days and maintained their viability staining. Additionally, the reported cell death at the pellet
thereafter. The cell death observed in the control pellet in core was also observed as a lower number of stained nuclei.
the first 7 days was avoided in the hydrogel culture, where Culture in Alpha 1 discloses different cell and material
the diffusion of oxygen and nutrients appeared to be more behaviors. First, it depicts degradation of the hydrogel
efficient as fewer dead cells were observed at the center of that occurs from day 0 up to day 14 in culture. As shown
the hydrogel.
in Figure 3, the hydrogels showed a smaller cross-section
This cell viability was further corroborated through which translated into a smaller overall hydrogel volume.
DNA quantification. As expected, both 3D systems Additionally, this showed the homogeneous distribution of
showed high levels of DNA on day 0, but these significantly cells within the gel at day 0, confirming the controlled cell
decreased on day 7 and further on day 14. The decrease deposition that was expected from using 3D bioprinting
of this DNA content in the 3D pellet coincides with as a manufacturing technique. Secondly, a change in cell
the observed necrotic core, and it corresponds with morphology and distribution was observed over the
Volume 9 Issue 6 (2023) 461 https://doi.org/10.36922/ijb.0899