
Page 18 - v11i4
P. 18
International Journal of Bioprinting 3D-printed scaffolds for osteochondral defect
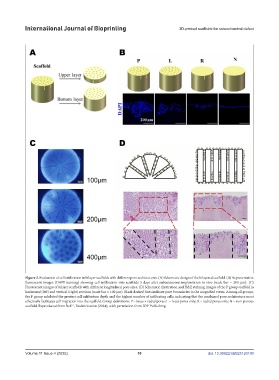
Figure 2. Evaluation of cell infiltration in bilayer scaffolds with different pore architectures. (A) Schematic design of the bilayered scaffold. (B) Representative
fluorescent images (DAPI staining) showing cell infiltration into scaffolds 5 days after subcutaneous implantation in vivo (scale bar = 200 μm). (C)
Fluorescent images of bilayer scaffolds with different longitudinal pore sizes. (D) Schematic illustration and H&E staining images of the P group scaffold in
horizontal (left) and vertical (right) sections (scale bar = 100 μm). Black dashed lines indicate pore boundaries in the magnified views. Among all groups,
the P group exhibited the greatest cell infiltration depth and the highest number of infiltrating cells, indicating that the combined pore architecture most
effectively facilitates cell migration into the scaffold. Group definitions: P = lotus + radial pores; L = lotus pores only; R = radial pores only; N = non-porous
61
scaffold. Reproduced from Ref. , Biofabrication (2024), with permission from IOP Publishing.
Volume 11 Issue 4 (2025) 10 doi: 10.36922/IJB025120100