
Page 208 - v11i4
P. 208
International Journal of Bioprinting Bioprinted osteoarthritis scaffolds
indicate that decreased cell viability primarily results from 3.3. Development and functional characterization of
high shear stress at the nozzle tip during printing. 60–62 In a 2D chondrocytes senescence model
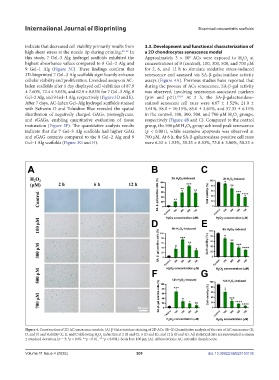
this study, 7 Gel–3 Alg hydrogel scaffolds exhibited the Approximately 3 × 10 ACs were exposed to H O at
6
2
2
highest absorbance values compared to 8 Gel–2 Alg and concentrations of 0 (control), 100, 300, 500, and 700 μM
9 Gel–1 Alg (Figure 3C). These findings confirm that for 2, 6, and 12 h to simulate oxidative stress-induced
3D-bioprinted 7 Gel–3 Alg scaffolds significantly enhance senescence and assessed via SA-β-galactosidase activity
cellular viability and proliferation. Live/dead assays on AC- assays (Figure 4A). Previous studies have reported that
laden scaffolds after 1 day displayed cell viabilities of 87.9 during the process of ACs senescence, SA-β-gal activity
± 7.60%, 72.4 ± 5.03%, and 62.9 ± 0.83% for 7 Gel–3 Alg, 8 was observed, involving senescence-associated markers
Gel–2 Alg, and 9 Gel–1 Alg, respectively (Figure 3D and E). (p16 and p21). 63,64 At 2 h, the SA-β-galactosidase-
After 7 days, AC-laden Gel–Alg hydrogel scaffolds stained stained senescent cell rates were 4.67 ± 1.52%, 21.0 ±
with Safranin O and Toluidine Blue revealed the spatial 3.61%, 58.0 ± 10.15%, 85.0 ± 3.61%, and 57.33 ± 6.11%
distribution of negatively charged GAGs, proteoglycans, in the control, 100, 300, 500, and 700 μM H O groups,
2
2
and sGAGs, enabling quantitative evaluation of tissue respectively (Figure 4B and C). Compared to the control
maturation (Figure 3F). The quantitative analysis results group, the 500 μM H₂O₂ group achieved peak senescence
indicate that the 7 Gel–3 Alg scaffolds had higher GAG (p < 0.001), while extensive apoptosis was observed at
and sGAG contents compared to the 8 Gel–2 Alg and 9 700 μM. At 6 h, the SA-β-galactosidase-positive cell rates
Gel–1 Alg scaffolds (Figure 3G and H). were 6.33 ± 1.53%, 35.33 ± 8.33%, 75.0 ± 3.00%, 50.33 ±
Figure 4. Construction of 2D AC senescence models. (A) β-Galactosidase staining of 2D ACs. (B–G) Quantitative analysis of the rate of AC senescence (B,
D, and F) and viability (C, E, and F) following H O induction at 2 (B and C), 6 (D and E), and 12 h (F and G). All statistical data are represented as mean
2
2
± standard deviation (n = 3; *p < 0.05, **p < 0.01, ***p < 0.001). Scale bar: 100 µm (A). Abbreviations: AC, articular chondrocyte.
Volume 11 Issue 4 (2025) 200 doi: 10.36922/IJB025150136