
Page 210 - v11i4
P. 210
International Journal of Bioprinting Bioprinted osteoarthritis scaffolds
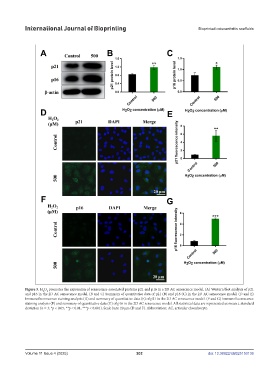
Figure 5. H O promotes the expression of senescence-associated proteins p21 and p16 in a 2D AC senescence model. (A) Western blot analysis of p21
2
2
and p16 in the 2D AC senescence model. (B and C) Summary of quantitative data of p21 (B) and p16 (C) in the 2D AC senescence model. (D and E)
Immunofluorescence staining analysis (D) and summary of quantitative data (E) of p21 in the 2D AC senescence model. (F and G) Immunofluorescence
staining analysis (F) and summary of quantitative data (G) of p16 in the 2D AC senescence model. All statistical data are represented as mean ± standard
deviation (n = 3; *p < 0.05, **p < 0.01, ***p < 0.001). Scale bars: 20 µm (D and F). Abbreviation: AC, articular chondrocyte.
Volume 11 Issue 4 (2025) 202 doi: 10.36922/IJB025150136