
Page 350 - v11i4
P. 350
International Journal of Bioprinting GradGelMA 3D-bioprinted vascular skin
a significant impact on the growth characteristics of a transitional layer, whereas the structure printed using the
cells, such as cell-oriented growth and the degree of FCP method showed a distinct boundary between layers
differentiation and maturation. 46-48 HaCaT cell suspension (Figure 6C). To quantify the interlayer bonding strength,
was dropped onto the surface of 20% (w/v) GelMA samples the samples were cultured in vitro for 96 h to simulate the
with groove textures and smooth planar film, respectively. skin substitute. Tensile testing results (Figure 6D) revealed
On Day 1, HaCaT cells on the grooved samples exhibited that the fracture strength at the bonding interface of
a clear tendency to grow along the grooves, while cells on FCP was 9.6 ± 1.4 kPa, while that of PCP was 18.4 ± 2.5
the smooth planar membranes appeared scattered and kPa. The PCP method effectively enhanced the bonding
clustered. By Day 5, HaCaT cells on the grooved samples strength between different layers, increasing it by 91.67%
continued to grow along the grooves without forming a compared with the FCP method. The reason may be that
continuous layer. In contrast, cells on the smooth planar the upper-layer ink in the PCP printing method can form
membranes had largely converged into a continuous layer an intertwined structure with the lower-layer ink, thus
(Figure 6A). improving the inter-layer bonding strength. Based on the
PCP process, a four-layer skin model was printed by mixing
The multi-concentration layer fusion process is shown pigments into inks of different concentrations (Figure 6E).
in Figure 6B. The cross-sectional images show that the The thickness of each layer can be controlled to vary, with
bilayer structure printed using the PCP method exhibited the thick layer exceeding 1 mm and the thin layer less than
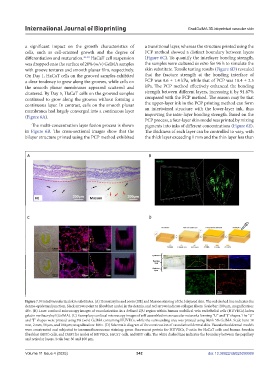
Figure 7. Printed vascularized skin substitutes. (A) Hematoxylin and eosin (HE) and Masson staining of the bilayered skin. The red dashed line indicates the
dermo-epidermal junction, black arrows point to fibroblast nuclei in the dermis, and red arrows indicate collagen fibers. Scale bar: 200 µm, magnification:
40×. (B) Laser confocal microscopy images of vascularization in a defined ZJU region within human umbilical vein endothelial cells (HUVECs)-laden
gelatin methacryloyl (GelMA). (C) Exemplary confocal microscopy images of self-assembled microvascular networks forming “U” and “J” shapes. The “U”
and “J” shapes were printed using 3% (w/v) GelMA containing HUVECs, while the surrounding area was printed using blank 5% GelMA. Scale bars: 10
mm, 2 mm, 50 µm, and 100 µm; magnification: 100×. (D) Schematic diagram of the construction of vascularized dermal skin. Vascularized dermal models
were constructed and subjected to immunofluorescence staining: green fluorescent protein for HUVECs, F-actin for HaCaT cells and human foreskin
fibroblast (HFF) cells, and DAPI for nuclei of HUVECs, HaCaT cells, and HFF cells. The white dashed line indicates the boundary between the papillary
and reticular layers. Scale bar: 30 and 100 µm.
Volume 11 Issue 4 (2025) 342 doi: 10.36922/IJB025090069