
Page 349 - v11i4
P. 349
International Journal of Bioprinting GradGelMA 3D-bioprinted vascular skin
(Figure 5I), indicating that when vascular endothelial cells be because the small pore structures within the higher-
form tubes, the intercellular signal transduction and other concentration hydrogel restrict the inward growth
interaction mechanisms may occur more intensively, and of HUVECs. This property supports the controlled
the cell functional activities are more frequent. construction of microvascular network distribution
regions, enabling the formation of a papillary layer with a
In the 3% (w/v) GelMA samples, HUVECs exhibited microvascular network and a reticular layer without one.
spreading by Day 5. Cell migration into the blank A VS substitute with distinct layered characteristics can
hydrogel was observed in the 3–3% (w/v) test samples, be constructed based on this.
with a migration distance of 197.12 ± 47.51 μm by Day
10, nearly equivalent to the length of a single HUVEC. In 3.5. Single-concentration line fusion for planar film
contrast, no migration was observed in the 3–5% (w/v) printing and multi-concentration layer fusion
test samples, with no significant change in migration Numerous studies have confirmed that the morphology
distance between Days 5 and 10 (Figure 5J). This may and mechanical properties of hydrogel substrates have
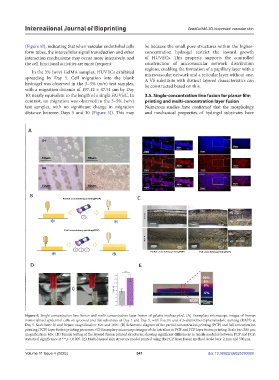
Figure 6. Single-concentration line fusion and multi-concentration layer fusion of gelatin methacryloyl. (A) Exemplary microscope images of human
immortalized epidermal cells on grooved and flat substrates at Day 1 and Day 5, with F-actin and 4ʹ,6-diamidino-2-phenylindole staining (DAPI) at
Day 5. Scale bars: 50 and 30 µm; magnification: 40× and 100×. (B) Schematic diagram of the partial concentration printing (PCP) and full concentration
printing (FCP) layer fusion printing processes. (C) Exemplary microscope images of the interface in PCP and FCP layer fusion printing. Scale bar: 200 µm;
magnification: 40×. (D) Tensile testing of the layered fusion printed structures, showing significant differences in tensile modulus between PCP and FCP;
statistical significance at ***p < 0.005. (E) Multi-layered skin structure model printed using the FCP layer fusion method. Scale bars: 2 mm and 500 µm.
Volume 11 Issue 4 (2025) 341 doi: 10.36922/IJB025090069