
Page 389 - v11i4
P. 389
International Journal of Bioprinting Bioprinted vascular tumor model
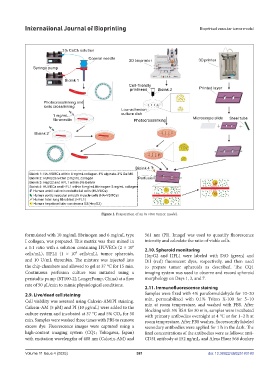
Figure 1. Preparation of an in vitro tumor model.
formulated with 10 mg/mL fibrinogen and 6 mg/mL type 561 nm (PI). ImageJ was used to quantify fluorescence
I collagen, was prepared. This matrix was then mixed in intensity and calculate the ratio of viable cells.
a 1:1 ratio with a solution containing HUVECs (2 × 10⁶ 2.10. Spheroid monitoring
cells/mL), HFL1 (1 × 10⁶ cells/mL), tumor spheroids, HepG2 and HFL1 were labeled with DiO (green) and
and 10 U/mL thrombin. The mixture was injected into DiI (red) fluorescent dyes, respectively, and then used
the chip chambers and allowed to gel at 37 °C for 15 min. to prepare tumor spheroids as described. The CQ1
Continuous perfusion culture was initiated using a imaging system was used to observe and record spheroid
peristaltic pump (BT100-2J; LongerPump, China) at a flow morphology on Days 1, 3, and 7.
rate of 50 μL/min to mimic physiological conditions.
2.11. Immunofluorescence staining
2.9. Live/dead cell staining Samples were fixed with 4% paraformaldehyde for 10–20
Cell viability was assessed using Calcein-AM/PI staining. min, permeabilized with 0.1% Triton X-100 for 5–10
Calcein-AM (5 μM) and PI (10 μg/mL) were added to the min at room temperature, and washed with PBS. After
blocking with 5% BSA for 30 min, samples were incubated
culture system and incubated at 37 °C and 5% CO₂ for 30 with primary antibodies overnight at 4 °C or for 1–2 h at
min. Samples were washed three times with PBS to remove room temperature. After PBS washes, fluorescently labeled
excess dye. Fluorescence images were captured using a secondary antibodies were applied for 1 h in the dark. The
high-content imaging system (CQ1; Yokogawa, Japan) final concentrations of the antibodies were as follows: anti-
with excitation wavelengths of 488 nm (Calcein-AM) and CD31 antibody at 152 ng/mL, and Alexa Fluor 568 donkey
Volume 11 Issue 4 (2025) 381 doi: 10.36922/IJB025180180