
Page 390 - v11i4
P. 390
International Journal of Bioprinting Bioprinted vascular tumor model
anti-rabbit IgG at 4 μg/mL. Staining results were imaged conforming to a normal distribution were subjected to
using the CQ1 fluorescence microscope to analyze protein parametric analysis. The p-values were calculated via a two-
expression and localization. tailed Student’s t-test for comparisons between two groups
or one-way analysis of variance (ANOVA) for multiple
2.12. Cytoskeleton staining group comparisons. Significance levels are indicated as *
Fixed and permeabilized samples were stained with for p < 0.05, ** for p < 0.01, *** for p < 0.001, and N.S. for
Phalloidin-FITC (10 μg/mL) in the dark at room no significant difference.
temperature for 1 h. After three washes with PBST (0.1%
Triton X-100 in PBS, pH 7.4), samples were imaged using 3. Results and discussion
the CQ1 system under 488 nm excitation to visualize
cytoskeletal structures. 3.1. Fabrication of hollow tubes using
a coaxial nozzle
2.13. Quantitative reverse transcription polymerase To achieve a balance between the mechanical properties
chain reaction and biocompatibility of the hollow tubes, we systematically
Gene expression was analyzed by quantitative reverse investigated the formulation of alginate, collagen, and
transcription polymerase chain reaction (qRT-PCR). Total GelMA in the bioink. As displayed in Figure 2A, under a
RNA was extracted using a commercial kit following the fixed GelMA concentration of 3% (w/v), stable hollow tube
manufacturer’s instructions. RNA concentration and purity formation was achieved when the alginate concentration
were assessed using a microvolume spectrophotometer (LB ranged from 1% to 1.5% (w/v) and collagen was maintained
915; Colibri, Germany). Complementary DNA (cDNA) at 5 mg/mL. However, this formulation exhibited limited
was synthesized from RNA using a commercial reverse biocompatibility and failed to support the formation of a
transcription kit. SYBR Green-based qRT-PCR (Roche, dense endothelial layer. Through further optimization, we
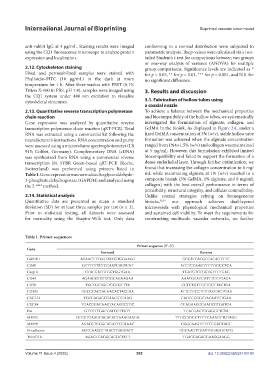
Switzerland) was performed using primers listed in found that increasing the collagen concentration to 8 mg/
Table 1. Gene expression was normalized to glyceraldehyde- mL while maintaining alginate at 1% (w/v) resulted in a
3-phosphate dehydrogenase (GAPDH) and analyzed using composite bioink (3% GelMA, 1% alginate, and 8 mg/mL
the 2 −ΔΔCt method. collagen) with the best overall performance in terms of
printability, structural integrity, and cellular compatibility.
2.14. Statistical analysis Unlike coaxial strategies relying on homogeneous
Quantitative data are presented as mean ± standard bioinks, 38,39 our approach achieves dual-layered
deviation (SD) for at least three samples per test (n ≥ 3). microvessels with physiological mechanical properties
Prior to statistical testing, all datasets were assessed and sustained cell viability. To meet the requirements for
for normality using the Shapiro-Wilk test. Only data constructing multiscale vascular networks, we further
Table 1. Primer sequences
Primer sequence (5’–3’)
Gene
Forward Reverse
GAPDH ACAACTTTGGTATCGTGGAAGG GCCATCACGCCACAGTTTC
CD40 GCTTCTTCTCCAATCAGTCAT ACCTCCAAGTTCTTATCCTCA
Casp-4 CTACGATGTGGTGGTGAA TGATGTCTGGTGTTCTGAG
CD44 AGAAGGTGTGGGCAGAAGAA AAATGCACCATTTCCTGAGA
CD70 TGCTGCTGGTGGTGTTTA CCTCTGTTGCTGCTTACTGA
CD133 GGCCCAGTACAACACTACCAA ATTCCGCCTCCTAGCACTGAA
CXCL12 TGCCAGAGCCAACGTCAAG CAGCCGGGCTACAATCTGAA
CXCR4 TGACGGACAAGTACAGGCTGC CCAGAAGGGAAGCGTGATGA
Fas GTTGTTGACCATCCTTGTT TCACGACTGGAGGTTCTA
MMP2 GTGCTGAAGGACACACTAAAGAAGA TTGCCATCCTTCTCAAAGTTGTAGG
MMP9 AGACCTGGGCAGATTCCAAAC CGGCAAGTCTTCCGAGTAGT
N-cadherin AGCCAACCTTAACTGAGGAGT GGCAAGTTGATTGGAGGGATG
Tnfrsf11b AGAGTGAGGCAGGCTATT TGAGGAGAGGAAGGAAGG
Volume 11 Issue 4 (2025) 382 doi: 10.36922/IJB025180180