
Page 394 - v11i4
P. 394
International Journal of Bioprinting Bioprinted vascular tumor model
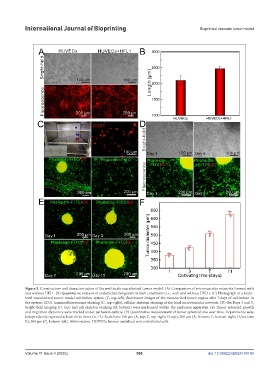
Figure 5. Construction and characterization of the multiscale vascularized tumor model. (A) Comparison of microvascular networks formed with
and without HFL1. (B) Quantitative analysis of endothelial elongation in both conditions (i.e., with and without HFL1). (C) Photograph of a multi-
level vascularized tumor model cultivation system (C, top-left); fluorescent images of the vascularized tumor region after 7 days of cultivation in
the system: CD31 immunofluorescence staining (C, top-right), cellular skeleton staining of the local microvascular network. (D) On Days 3 and 5,
bright-field imaging (D, top) and cell skeleton staining (D, bottom) were performed within the perfusion apparatus. (E) Tumor spheroid growth
and migration dynamics were tracked under perfusion culture. (F) Quantitative measurement of tumor spheroid size over time. Experiments were
independently repeated at least three times (n ≥ 3). Scale bars: 100 µm (A, top; C, top-right; D, top); 200 µm (A, bottom; C, bottom-right; D, bottom;
E); 300 µm (C, bottom-left). Abbreviation: HUVECs, human umbilical vein endothelial cells.
Volume 11 Issue 4 (2025) 386 doi: 10.36922/IJB025180180