
Page 21 - IJOCTA-15-2
P. 21
A. R´acz / IJOCTA, Vol.15, No.2, pp.215-224 (2025)
the mentioned model is to meet the requirements 2.1. Problem definition
using minimal number of bars, secondary objec-
Using the notations from Table 1., the problem
tive is to organize the cutting so that the maxi-
mum quantity of leftovers is accumulated in one can be described as follows: A company sells one
bar. The model of Rahimi et al for rebar cutting dimensional cut-to-size materials. They have a
optimization in conrete industry 10 has an objec- stock of raw materials, bars: B1, B 2 , . . . , B n given
tive with three component: purchase costs, cut by their length l 1 , l 2 , . . . , l n . An O 1 , O 2 , . . . , O m
costs and bend cost. In study, 11 the researchers group of orders should be served with required
length r 1 , r 2 , . . . , r m . The cost of a cut is in-
introduced an approach to determine the opti-
dicated by the parameter CC. Bars that are
mal stock size to meet expected demand, aim-
longer than W are worth to stock and can be
ing to minimize the overall costs associated with
sold. They want to minimize the non reusable
waste, storage, and unmet orders. Model created
by Tanir et al 12 aims to minimize both trim loss leftovers, that are identified as a waste. So,
and the number of welds while accommodating we are using two definition for the remain-
der: leftover LOl 1 , LOl 2 , . . . , LOl n on the bars,
practical constraints in the steel industry.
that can be reused and those that are shorter
The models mentioned above, as well as
than the limit W,that is the waste on the bars
industry-specific solutions, are usually highly cus-
WL 1 , WL 2 , . . . , WL n . Thus, after the optimiza-
tomised. My aim was to develop a general model
tion the variables LOl 1 , LOl 2 , . . . , LOl n deter-
that could combine the three objectives consid-
mines the new stock for the next process. The
ering a user defined priority. In this way, the
waste means a financial loss to the company, that
model would be parameterisable, customisable
is described by a loss coefficient CW. They also
and widely applicable, taking into account differ-
have a setup cost, which appears when a new
ent industry specific cost factors and objectives.
bar is put under the saw. Therefore, they would
The user can specify how much a cut costs, how
like to minimize the number of bars involved. In
large the financial loss is if a unit of waste is gen-
summary: The company wants to minimize the
erated and the importance of the number of bars
costs of cutting, setup and the loss of waste, while
in the service process.
serving the orders.
In Section 2, we describe our Multiobjective,
Adjustable Cost and Recycling parametric
OPTimization model for 1 Dimensional cutting
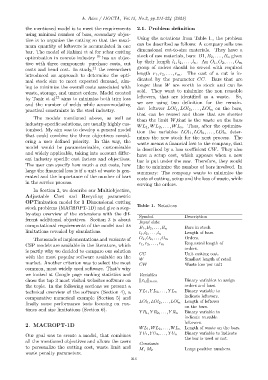
Table 1. Notations
stock problems (MACROPT-1D) and give a step-
by-step overview of the extensions with the dif-
Symbol Description
ferent additional objectives. Section 3 is about
Input data
computational requirements of the model and its
B 1 , B 2 , . . . , B n Bars in stock.
limitations revealed by simulations.
l 1 , l 2 , . . . , l n Length of bars.
Thousands of implementations and variants of O 1 , O 2 , . . . , O m Orders.
CSP models are available in the literature, which r 1 , r 2 , . . . , r m Requested length of
orders.
is partly why we decided to compare our solution
CC Unit cutting cost.
with the most popular software available on the
W Smallest length of retail
market. Another criterion was to select the most CW Waste loss per unit
common, most widely used software. That’s why
we looked at Google page ranking statistics and Variables
chose the top 3 most visited websites software on ||x ij || m×n Binary variables to assign
the topic. In the following sections we present a orders and bars.
technical overview of the software (Section 4), a Y L 1 , Y L 2 , . . . , Y L n Binary variable to
indicate leftovers.
comparative numerical example (Section 5) and
LOl 1 , LOl 2 , . . . , LOl n Length of leftover
finally some performance tests focusing on run-
on the bars.
times and size limitations (Section 6).
Y R 1 , Y R 2 , . . . , Y R n Binary variable to
indicate reusable
leftovers.
2. MACROPT-1D
WL 1 , WL 2 , . . . , WL n Length of waste on the bars.
Our goal was to create a model, that combines Y U 1 , Y U 2 , . . . , Y U n Binary variable to indicate
the bar is used or not.
all the mentioned objectives and allows the users
Constants
to personalize the cutting cost, waste limit and
M, M 2 Large positive numbers.
waste penalty parameters.
216