
Page 17 - IJOCTA-15-2
P. 17
M. Perala, S. Chandrasekaran, E. Begovic / IJOCTA, Vol.15, No.2, pp.202-214 (2025)
reaction, pushing the vessel’s position down to ap-
proximately 55 m by the end of the 300 s simula-
tion. This overcorrection acts as an impact load
on the structure, creating an undesirable situation
that’s potentially as problematic as the original
drift.
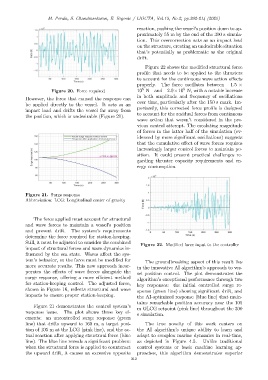
Figure 22 shows the modified structural force
profile that needs to be applied to the thrusters
to account for the continuous wave action effects
properly. The force oscillates between −1.5 ×
5
5
Figure 20. Force required 10 N and 2.0×10 N, with a notable increase
in both amplitude and frequency of oscillations
However, the force that caused the response can
be applied directly to the vessel. It acts as an over time, particularly after the 150 s mark. Im-
impact load and drifts the vessel far away from portantly, this corrected force profile is designed
the position, which is undesirable (Figure 21). to account for the residual forces from continuous
wave action that weren’t considered in the pre-
vious control attempt. The escalating magnitude
of forces in the latter half of the simulation (ev-
idenced by more significant oscillations) suggests
that the cumulative effect of wave forces requires
increasingly larger control forces to maintain po-
sition. It could present practical challenges re-
garding thruster capacity requirements and en-
ergy consumption.
Figure 21. Surge response
Abbreviation: LCG: Longitudinal center of gravity
The force applied must account for structural
and wave forces to maintain a vessel’s position
and prevent drift. The system’s requirements
determine the force required for station-keeping.
Still, it must be adjusted to consider the combined
Figure 22. Modified force input to the controller
impact of structural forces and wave dynamics in-
fluenced by the sea state. Waves affect the sys-
tem’s behavior, so the force must be modified for
The groundbreaking aspect of this result lies
more accurate results. This new approach incor-
in the innovative AI algorithm’s approach to ves-
porates the effects of wave forces alongside the
sel position control. The plot demonstrates the
surge response, offering a more efficient method
algorithm’s exceptional performance through two
for station-keeping control. The adjusted force, key responses: the initial controlled surge re-
shown in Figure 16, reflects structural and wave sponse (green line) showing significant drift, and
impacts to ensure proper station-keeping. the AI-optimized response (blue line) that main-
tains remarkable position accuracy near the 105
Figure 21 demonstrates the control system’s m @LCG setpoint (pink line) throughout the 300
response issue. The plot shows three key el- s simulation.
ements: an uncontrolled surge response (green
line) that drifts upward to 160 m, a target posi- The true novelty of this work centers on
tion of 105 m at the LCG (pink line), and the ac- the AI algorithm’s unique ability to learn and
tual reaction after applying structural force (blue adapt to complex marine dynamics in real-time,
line). The blue line reveals a significant problem: as depicted in Figure 4.5. Unlike traditional
when the structural force is applied to counteract control systems or basic machine learning ap-
the upward drift, it causes an excessive opposite proaches, this algorithm demonstrates superior
212