
Page 13 - IJOCTA-15-2
P. 13
M. Perala, S. Chandrasekaran, E. Begovic / IJOCTA, Vol.15, No.2, pp.202-214 (2025)
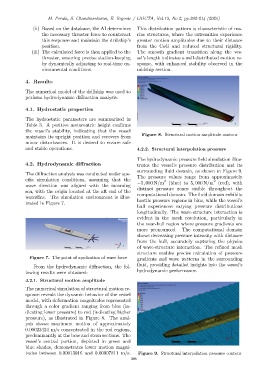
(ii) Based on the database, the AI determines This distribution pattern is characteristic of ma-
the necessary thruster force to counteract rine structures, where the extremities experience
this response and maintain the drillship’s greater motion amplitudes due to their distance
position. from the CoG and reduced structural rigidity.
(iii) The calculated force is then applied to the The smooth gradient transition along the ves-
thruster, ensuring precise station-keeping sel’s length indicates a well-distributed motion re-
by dynamically adjusting to real-time en- sponse, with enhanced stability observed in the
vironmental conditions. midship section.
4. Results
The numerical model of the drillship was used to
perform hydrodynamic diffraction analysis.
4.1. Hydrostatic properties
The hydrostatic parameters are summarized in
Table 3. A positive metacentric height confirms
the vessel’s stability, indicating that the vessel
Figure 8. Structural motion amplitude contour
maintains its upright position and recovers from
minor disturbances. It is desired to ensure safe
and stable operations. 4.2.2. Structural interpolation pressure
The hydrodynamic pressure field simulation illus-
4.2. Hydrodynamic diffraction trates the vessel’s pressure distribution and its
surrounding fluid domain, as shown in Figure 9.
The diffraction analysis was conducted under spe-
The pressure values range from approximately
cific simulation conditions, assuming that the 2 2
−5, 000 N/m (blue) to 5, 000 N/m (red), with
wave direction was aligned with the incoming
distinct pressure zones visible throughout the
sea, with the origin located at the aft end of the
computational domain. The fluid domain exhibits
waterline. The simulation environment is illus-
hostile pressure regions in blue, while the vessel’s
trated in Figure 7.
hull experiences varying pressure distributions
longitudinally. The wave-structure interaction is
evident in the mesh resolution, particularly in
the near-hull region where pressure gradients are
more pronounced. The computational domain
shows decreasing pressure intensity with distance
from the hull, accurately capturing the physics
of wave-structure interaction. The refined mesh
structure enables precise calculation of pressure
Figure 7. The point of application of wave force gradients and wave patterns in the surrounding
From the hydrodynamic diffraction, the fol- fluid, providing detailed insights into the vessel’s
lowing results were obtained: hydrodynamic performance.
4.2.1. Structural motion amplitude
The numerical simulation of structural motion re-
sponse reveals the dynamic behavior of the vessel
model, with deformation magnitudes represented
through a color gradient ranging from blue (in-
dicating lower pressure) to red (indicating higher
pressure), as illustrated in Figure 8. The anal-
ysis shows maximum motion of approximately
0.00023424 m/s concentrated in the red regions,
predominantly at the bow and stern sections. The
vessel’s central portion, depicted in green and
blue shades, demonstrates lower motion magni-
tudes between 0.00013016 and 0.00007811 m/s. Figure 9. Structural interpolation pressure contour
208