
Page 93 - IJOCTA-15-2
P. 93
¨
M. Yavuz, M. Ozt¨urk, B. Ya¸skıran / IJOCTA, Vol.15, No.2, pp.281-293 (2025)
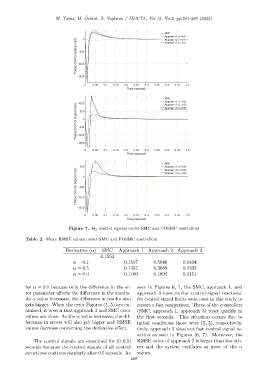
Figure 7. Θ 2 control signals under SMC and FOSMC controllers
Table 2. Mean RMSE values under SMC and FOSMC controllers
Derivative (α) SMC Approach 1 Approach 2 Approach 3
0.1553
α = 0.1 0.1537 0.5040 0.1494
α = 0.5 0.1357 0.3089 0.1332
α = 0.9 0.1160 0.1894 0.1151
for α = 0.1 because only the difference in the er- seen in Figures 6, 7, the SMC, approach 1, and
ror parameter affects the difference in the results. approach 3 have similar control signal reactions.
As α value increases, the difference in results also No control signal limits were used in this study to
gets bigger. When the error Figures (4, 5) are ex- ensure a fair comparison. Three of the controllers
amined, it is seen that approach 3 and SMC error (SMC, approach 1, approach 3) react quickly in
values are close. As the α value increases, the dif- the first seconds. This situation occurs due to
ferences in errors will also get bigger and RMSE initial conditions those were [ , ], respectively.
π π
4 2
values decrease concerning the derivative effect. Only, approach 2 does not fast control signal re-
action as seen in Figures (6, 7). Moreover, the
The control signals are examined for [0 0.5] RMSE value of approach 2 is larger than the oth-
seconds because the control signals of all control ers and the system oscillates at most of the α
structures continue regularly after 0.5 seconds. As values.
288