
Page 15 - IJPS-1-1
P. 15
Zachary Zimmer, Mira Hidajat, and Yasuhiko Saito
servations. Importantly, small percentages of females are higher educated. Estimates for
these sub-groups are cautiously interpreted.
3 Results
3.1 Description of Sample
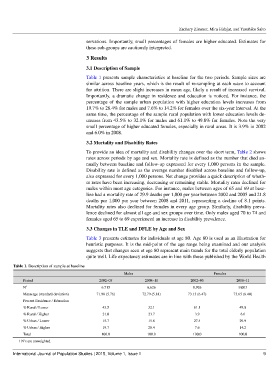
Table 1 presents sample characteristics at baseline for the two periods. Sample sizes are
similar across baseline years, which is the result of re-sampling at each wave to account
for attrition. There are slight increases in mean age, likely a result of increased survival.
Importantly, a dramatic change in residence and education is noticed. For instance, the
percentage of the sample urban population with higher education levels increases from
19.7% to 28.4% for males and 7.6% to 14.2% for females over the six-year interval. At the
same time, the percentage of the sample rural population with lower education levels de-
creases from 43.5% to 32.1% for males and 61.1% to 49.8% for females. Note the very
small percentage of higher educated females, especially in rural areas. It is 3.9% in 2002
and 6.0% in 2008.
3.2 Mortality and Disability Rates
To provide an idea of mortality and disability changes over the short term, Table 2 shows
rates across periods by age and sex. Mortality rate is defined as the number that died an-
nually between baseline and follow-up expressed for every 1,000 persons in the sample.
Disability rate is defined as the average number disabled across baseline and follow-up,
also expressed for every 1,000 persons. Net change provides a quick description of wheth-
er rates have been increasing, decreasing or remaining stable. Mortality rates declined for
males within most age categories. For instance, males between ages of 65 and 69 at base-
line had a mortality rate of 29.9 deaths per 1,000 per year between 2002 and 2005 and 21.8
deaths per 1,000 per year between 2008 and 2011, representing a decline of 8.1 points.
Mortality rates also declined for females in every age group. Similarly, disability preva-
lence declined for almost all age and sex groups over time. Only males aged 70 to 74 and
females aged 65 to 69 experienced an increase in disability prevalence.
3.3 Changes in TLE and DFLE by Age and Sex
Table 3 presents estimates for individuals at age 80. Age 80 is used as an illustration for
heuristic purposes. It is the mid-point of the age range being examined and our analysis
suggests that changes seen at age 80 represent main trends for the total elderly population
quite well. Life expectancy estimates are in line with those published by the World Health
Table 1. Description of sample at baseline
Males Females
Period 2002–05 2008–11 2002–05 2008–11
1
N 6,715 6,626 8,926 9,003
Mean age (standard deviation) 71.98 (5.76) 72.79 (5.81) 73.13 (6.47) 73.65 (6.40)
Percent Residence / Education
% Rural / Lower 43.5 32.1 61.1 49.8
% Rural / Higher 21.0 23.7 3.9 6.0
% Urban / Lower 15.7 15.8 27.4 29.9
% Urban / Higher 19.7 28.4 7.6 14.2
Total 100.0 100.0 100.0 100.0
1 N’s are unweighted.
International Journal of Population Studies | 2015, Volume 1, Issue 1 9