
Page 17 - IJPS-1-1
P. 17
Zachary Zimmer, Mira Hidajat, and Yasuhiko Saito
Organization (2012), indicating that mortality is reliably measured. In accordance with the
mortality and disability rates shown above, TLE and DFLE increased for both males and
females. For instance, life expectancy for males aged 80 was 6.90 in the 2002–05 period
(95% CI 6.69–7.11) and increased to 7.28 (95% CI 7.04–7.53) by the 2008–11 period,
representing a net change of +0.38 years. DFLE rose from 5.48 (95% CI 5.37–5.58) to
5.94 (95% CI 5.84–6.05) over the same period, representing a net change of +0.46 years.
The entire increase in life expectancy plus a bit is accounted for by time spent disabili-
ty-free. Females experienced greater net increases in both TLE and DFLE. TLE rose from
7.61 to 8.20 (95% CI 7.36–7.86 and 7.89–8.51) and DFLE from 5.51 to 6.46 (95% CI
5.39–5.64 and 6.35–6.58).
For males the DFLE/TLE ratio increased from 0.794 to 0.816. This is a positive change
and therefore suggestive of a compression of morbidity. However, 95% confidence intervals
indicate that the increase is not statistically significant. We draw this conclusion because
the 95% intervals, shown in the table, overlap. Therefore, there is not enough change over
time to be 95% certain that males aged 80 experienced relatively more years disability-free
in the later period. For females however, there is a greater increase in the ratio from 0.724
to 0.788, and the 95% confidence intervals do not overlap, suggesting a statistically signif-
icant improvement. Therefore, while females overall spend a lesser proportion of remain-
ing life at age 80 disability-free, the improvement in DFLE is more robust for females.
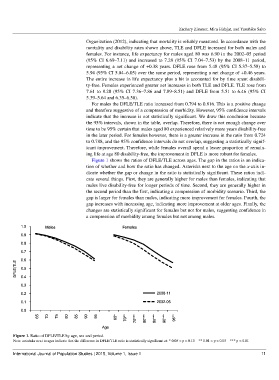
Figure 1 shows the ratios of DFLE/TLE across ages. The gap in the ratios is an indica-
tion of whether and how the ratio has changed. Asterisks next to the age on the x-axis in-
dicate whether the gap or change in the ratio is statistically significant. These ratios indi-
cate several things. First, they are generally higher for males than females, indicating that
males live disability-free for longer periods of time. Second, they are generally higher in
the second period than the first, indicating a compression of morbidity scenario. Third, the
gap is larger for females than males, indicating more improvement for females. Fourth, the
gap increases with increasing age, indicating more improvement at older ages. Finally, the
changes are statistically significant for females but not for males, suggesting confidence in
a compression of morbidity among females but not among males.
Figure 1. Ratio of DFLE/TLE by age, sex and period.
Note: asterisks next to ages indicate that the difference in DFLE/TLE ratio is statistically significant at: * 0.05 < p < 0.10 ** 0.01 < p < 0.05 *** p < 0.01
International Journal of Population Studies | 2015, Volume 1, Issue 1 11