
Page 18 - IJPS-1-1
P. 18
Changes in total and disability-free life expectancy among older adults in China: Do they portend a compression of morbidity?
3.4 Changes in TLE and DFLE by Rural/urban Residence and Education
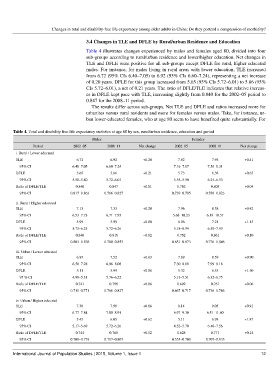
Table 4 illustrates changes experienced by males and females aged 80, divided into four
sub-groups according to rural/urban residence and lower/higher education. Net changes in
TLE and DFLE were positive for all sub-groups except DFLE for rural, higher educated
males. For instance, for males living in rural areas with lower education, TLE increased
from 6.72 (95% CIs 6.40–7.05) to 6.92 (95% CIs 6.60–7.24), representing a net increase
of 0.20 years. DFLE for this group increased from 5.65 (95% CIs 5.72–6.01) to 5.86 (95%
CIs 5.72–6.01), a net of 0.21 years. The ratio of DFLE/TLE indicates that relative increas-
es in DFLE kept pace with TLE, increasing slightly from 0.840 for the 2002–05 period to
0.847 for the 2008–11 period.
The results differ across sub-groups. Net TLE and DFLE and ratios increased more for
urbanites versus rural residents and more for females versus males. Take, for instance, ur-
ban lower-educated females, who at age 80 seem to have benefited quite substantially. For
Table 4. Total and disability free life expectancy statistics at age 80 by sex, rural/urban residence, education and period
Males Females
Period 2002–05 2008–11 Net change 2002–05 2008–11 Net change
i. Rural / Lower educated
TLE 6.72 6.92 +0.20 7.52 7.93 +0.41
95% CI 6.40–7.05 6.60–7.24 7.16–7.87 7.56–8.31
DFLE 5.65 5.86 +0.21 5.73 6.38 +0.65
95% CI 5.50–5.80 5.72–6.01 5.55–5.90 6.24–6.53
Ratio of DFLE/TLE 0.840 0.847 +0.01 0.762 0.805 +0.04
95% CI 0.817–0.863 0.766–0.827 0.739–0.785 0.786–0.823
ii. Rural / Higher educated
TLE 7.13 7.33 +0.20 7.96 8.38 +0.42
95% CI 6.53–7.73 6.71–7.95 5.68–10.23 6.19–10.57
DFLE 5.99 5.99 +0.00 6.06 7.21 +1.15
95% CI 5.73–6.25 5.72–6.26 5.18–6.94 6.50–7.93
Ratio of DFLE/TLE 0.840 0.816 −0.02 0.762 0.861 +0.10
95% CI 0.803–0.876 0.780–0.853 0.651–0.873 0.776–0.946
iii. Urban / Lower educated
TLE 6.89 7.52 +0.63 7.69 8.59 +0.90
95% CI 6.50–7.28 6.96–8.08 7.30–8.08 7.99–9.18
DFLE 5.11 5.99 +0.88 5.32 6.53 +1.30
95 % CI 4.90–5.31 5.76–6.22 5.13–5.51 6.32–6.75
Ratio of DFLE/TLE 0.741 0.796 +0.06 0.692 0.761 +0.06
95% CI 0.711–0.771 0.766–0.827 0.667–0.717 0.736–0.786
iv. Urban / Higher educated
TLE 7.30 7.96 +0.66 8.14 9.05 +0.91
95% CI 6.77–7.84 7.00–8.91 6.97–9.30 6.51–11.60
DFLE 5.43 6.05 +0.62 5.11 6.98 +1.87
95% CI 5.17–5.69 5.72–6.26 4.52–5.70 6.40–7.56
Ratio of DFLE/TLE 0.744 0.760 +0.02 0.628 0.771 +0.14
95% CI 0.708–0.779 0.717–0.803 0.555–0.700 0.707–0.835
International Journal of Population Studies | 2015, Volume 1, Issue 1 12