
Page 16 - IJPS-1-1
P. 16
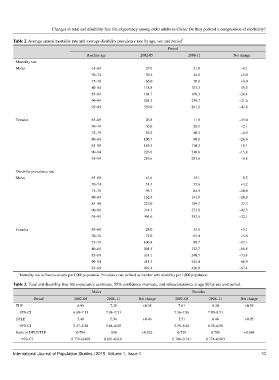
Changes in total and disability-free life expectancy among older adults in China: Do they portend a compression of morbidity?

                                                                               1
       Table 2. Average annual mortality rate and average disability prevalence rate by age, sex and period
                                                                         Period
                                      Baseline age           2002-05             2008-11             Net change
        Mortality rate
        Males                           65–69                  29.9                 21.8                –8.1
                                        70–74                  39.4                 44.4                +5.0
                                        75–79                  66.0                 70.0                +4.0
                                        80–84                 118.8                103.3               –15.5
                                        85–89                 184.7                160.3               –24.4
                                        90–94                 261.3                239.7               –21.6
                                        95–99                 339.0                291.2               –47.8

        Females                         65–69                  26.8                 11.8               –15.0
                                        70–74                  30.6                 28.5                –2.1
                                        75–79                  59.2                 50.3                –8.9
                                        80–84                 106.7                 80.1               –26.6
                                        85–89                 149.3                130.2               –19.1
                                        90–94                 226.6                210.8               –15.8
                                        95–99                 289.6                283.8                –5.8

        Disability prevalence rate
        Males                           65–69                  43.6                 35.1                –8.5
                                        70–74                  51.4                 55.6                +4.2
                                        75–79                  95.7                 84.9               –10.8
                                        80–84                 162.4                141.6               –20.8
                                        85–89                 227.0                199.7               –27.3
                                        90–94                 314.3                272.0               –42.3
                                        95–99                 404.6                382.5               –22.1

        Females                         65–69                  28.0                 33.1                +5.1
                                        70–74                  71.0                 65.4                –5.6
                                        75–79                 106.8                 89.7               –17.1
                                        80–84                 201.5                132.7               –68.8
                                        85–89                 314.1                240.7               –73.4
                                        90–94                 411.3                344.4               –66.9
                                        95–99                 493.4                426.0               –67.4
         1 Mortality rate defined as deaths per 1,000 population. Prevalence rate defined as number with disability per 1,000 population.

       Table 3. Total and disability free life expectancy estimates, 95% confidence intervals, and related statistics at age 80 by sex and period
                                        Males                                      Females
               Period            2002–05       2008–11      Net change      2002–05       2008–11       Net change
        TLE                       6.90          7.28          +0.38          7.61           8.20         +0.59
           95% CI               6.69–7.11     7.04–7.53                    7.36–7.86      7.89–8.51
        DFLE                      5.48          5.94          +0.46          5.51           6.46         +0.95
           95% CI               5.37–5.58     5.84–6.05                    5.39–5.64      6.35–6.58
        Ratio of DFLE/TLE         0.794         .816          +0.022         0.724         0.788         +0.064
            95% CI             0.779–0.809   0.801–0.831                   0.708–0.741   0.774–0.803


       International Journal of Population Studies | 2015, Volume 1, Issue 1                                    10