
Page 19 - IJPS-1-1
P. 19
Zachary Zimmer, Mira Hidajat, and Yasuhiko Saito
them, net TLE increased by 0.90 years and DFLE by 1.30 years. The ratio of DFLE/TLE
rose from 0.692 to 0.761 and this change is statistically significant.
An important caveat is suggested by confidence intervals. Because numbers within
sub-groups can be small, some standard errors are large and subsequently confidence in-
tervals are wide. This is particularly the case for higher educated females in rural areas.
The point estimate for life expectancy in the 2008–11 period for this group is 8.38, but the
95% confidence interval varies from 6.19 to 10.57. Although the estimate for life expec-
tancy is reasonable, wide confidence intervals suggest instability. More importantly, the
95% confidence interval for the DFLE estimate is wide, and thus despite a relatively large
increase in the DFLE/TLE ratio, the finding is not statistically significant.
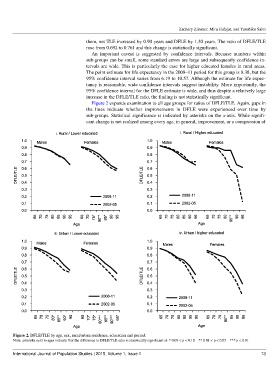
Figure 2 expands examination to all age groups for ratios of DFLE/TLE. Again, gaps in
the lines indicate whether improvements in DFLE were experienced over time by
sub-groups. Statistical significance is indicated by asterisks on the x-axis. While signifi-
cant change is not realized among every age, in general, improvement, or a compression of
Figure 2. DFLE/TLE by age, sex, rural/urban residence, education and period.
Note: asterisks next to ages indicate that the difference in DFLE/TLE ratio is statistically significant at: * 0.05 < p < 0.10 ** 0.01 < p < 0.05 *** p < 0.01
International Journal of Population Studies | 2015, Volume 1, Issue 1 13