Page 114 - IJPS-11-4
P. 114

International Journal of
            Population Studies                                                    Intergenerational transfers in Malaysia


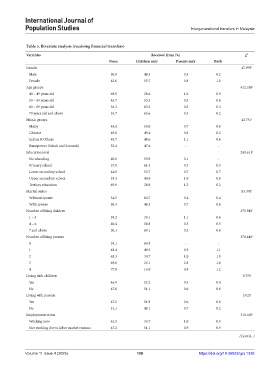
            Table 5. Bivariate analysis (receiving financial transfers)
            Variables                                            Received from (%)                       χ 2
                                               None        Children only    Parents only    Both
            Gender                                                                                      47.979 c
             Male                               50.9          48.5             0.5           0.2
             Female                             42.6          55.7             0.8           1.0
            Age groups                                                                                 412.188 c
             40 – 49 years old                  68.9          28.6             1.6           0.9
             50 – 59 years old                  45.7          53.5             0.2           0.6
             60 – 69 years old                  36.3          63.2             0.2           0.3
             70 years old and above             35.7          63.6             0.5           0.2
            Ethnic groups                                                                               42.751 c
             Malay                              44.4          54.0             0.7           0.8
             Chinese                            49.6          49.4             0.8           0.2
             Indian & Others                    49.7          48.6             1.1           0.6
             Bumiputera (Sabah and Sarawak)     52.4          47.6              -             -
            Education level                                                                            240.611 c
             No schooling                       40.0          59.8             0.1            -
             Primary school                     37.9          61.3             0.3           0.5
             Lower secondary school             44.9          53.7             0.7           0.7
             Upper secondary school             53.3          44.8             1.0           0.8
             Tertiary education                 69.9          28.8             1.2           0.2
            Marital status                                                                              83.370 c
             Without spouse                     34.5          64.7             0.4           0.4
             With spouse                        50.3          48.5             0.7           0.6
            Number of living children                                                                  275.945 c
             1 – 3                              59.2          39.1             1.1           0.6
             4 – 6                              40.4          58.8             0.3           0.5
             7 and above                        30.1          69.1             0.2           0.6
            Number of living parents                                                                   378.440 c
             0                                  39.1          60.9              -             -
             1                                  48.4          49.5             0.9           1.1
             2                                  63.3          34.7             1.0           1.0
             3                                  69.6          26.1             2.8           1.6
             4                                  77.8          16.0             4.9           1.2
            Living with children                                                                        0.759
             Yes                                46.9          52.2             0.5           0.4
             No                                 47.6          51.1             0.6           0.6
            Living with parents                                                                         5.029
             Yes                                47.0          51.8             0.6           0.6
             No                                 51.1          48.1             0.7           0.2
            Employment status                                                                          310.100 c
             Working now                        61.5          36.7             1.0           0.9
             Not working due to labor market reasons  47.2    51.1             0.9           0.9

                                                                                                       (Cont'd...)


            Volume 11 Issue 4 (2025)                       108                        https://doi.org/10.36922/ijps.1326
   109   110   111   112   113   114   115   116   117   118   119