
Page 111 - IJPS-11-4
P. 111
International Journal of
Population Studies Intergenerational transfers in Malaysia
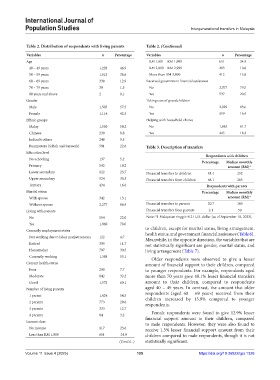
Table 2. Distribution of respondents with living parents Table 2. (Continued)
Variables n Percentage Variables n Percentage
Age RM 1,001 – RM 1,999 651 24.9
40 – 49 years 1,228 46.9 RM 2,000 – RM 2,999 283 10.8
50 – 59 years 1,012 38.6 More than RM 3,000 412 15.8
60 – 69 years 338 12.9 Received government financial assistance
70 – 79 years 39 1.5 No 2,077 79.5
80 years and above 2 0.1 Yes 537 20.5
Gender Taking care of grandchildren
Male 1,505 57.5 No 2,029 83.6
Female 1,114 42.5 Yes 399 16.4
Ethnic groups Helping with household chores
Malay 1,550 59.2 No 1,983 81.7
Chinese 230 8.8 Yes 445 18.3
Indian& others 248 9.5
Bumiputera (Sabah and Sarawak) 591 22.6 Table 3. Description of transfers
Education level
Respondents with children
No schooling 137 5.2
Percentage Median monthly
Primary 502 19.2 amount (RM)*
Lower secondary 622 23.7 Financial transfers to children 41.4 252
Upper secondary 924 35.3 Financial transfers from children 48.1 283
Tertiary 434 16.6 Respondents with parents
Marital status Percentage Median monthly
With spouse 342 13.1 amount (RM)*
Without spouse 2,277 86.9 Financial transfers to parents 20.7 100
Living with parents Financial transfers from parents 2.1 50
No 554 22.0 Note: *1 Malaysian ringgit=0.21 U.S. dollar (as of September 18, 2023).
Yes 1,960 78.0
Currently employment status to children, except for marital status, living arrangement,
health status, and government financial assistance (Table 6).
Not working due to labor market reasons 122 4.7 Meanwhile, in the opposite direction, the variables that are
Retired 305 11.7 not statistically significant are gender, marital status, and
Homemaker 797 30.5 living arrangement (Table 7).
Currently working 1,388 53.1 Older respondents were observed to give a lesser
Current health status amount of financial support to their children, compared
Poor 200 7.7 to younger respondents. For example, respondents aged
Moderate 842 32.2 more than 70 years gave 48.1% lesser financial transfers
Good 1,572 60.1 amount to their children, compared to respondents
Number of living parents aged 40 – 49 years. In contrast, the amount that older
1 parent 1,424 54.5 respondents (aged 60 – 69 years) received from their
2 parents 773 29.6 children increased by 13.9% compared to younger
respondents.
3 parents 333 12.7
4 parents 84 3.2 Female respondents were found to give 12.9% lesser
Income class financial support amount to their children, compared
to male respondents. However, they were also found to
No income 617 23.6 receive 1.3% lesser financial support amount from their
Less than RM 1,000 651 24.9 children compared to male respondents, though it is not
(Cont'd...) statistically significant.
Volume 11 Issue 4 (2025) 105 https://doi.org/10.36922/ijps.1326