
Page 120 - IJPS-11-5
P. 120
International Journal of
Population Studies Endowment insurance and family consumption in China
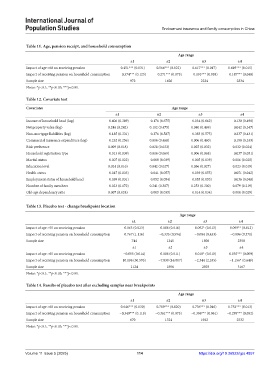
Table 11. Age, pension receipt, and household consumption
Age range
±1 ±2 ±3 ±4
Impact of age >60 on receiving pension 0.451*** (0.031) 0.566*** (0.022) 0.617*** (0.017) 0.649*** (0.015)
Impact of receiving pension on household consumption −0.374*** (0.125) −0.271*** (0.075) −0.193*** (0.058) −0.187*** (0.048)
Sample size 972 1626 2224 2834
Notes: *p<0.1; **p<0.05; ***p<0.01.
Table 12. Covariate test
Covariates Age range
±1 ±2 ±3 ±4
Income of household head (log) −0.406 (0.389) −0.176 (0.675) −0.034 (0.662) −0.130 (0.498)
Net property value (log) 0.246 (0.242) 0.102 (0.475) 0.040 (0.469) −0.042 (0.347)
Non-mortgage liabilities (log) −0.185 (0.331) −0.376 (0.587) −0.383 (0.575) −0.237 (0.431)
Commercial insurance expenditure (log) −0.232 (0.256) 0.006 (0.468) 0.006 (0.460) −0.198 (0.339)
Risk preference 0.009 (0.018) 0.028 (0.033) 0.025 (0.032) 0.032 (0.024)
Household registration type −0.013 (0.039) 0.016 (0.069) 0.006 (0.068) −0.037 (0.051)
Marital status −0.007 (0.022) −0.008 (0.039) −0.005 (0.039) 0.006 (0.028)
Education level 0.024 (0.016) 0.042 (0.027) 0.036 (0.027) 0.023 (0.019)
Health status −0.047 (0.033) −0.041 (0.057) −0.039 (0.055) −0.051 (0.042)
Employment status of household head −0.039 (0.031) −0.052 (0.054) −0.055 (0.053) −0.036 (0.040)
Number of family members −0.023 (0.172) 0.241 (0.307) 0.253 (0.300) 0.079 (0.219)
Old-age dependency ratio 0.007 (0.024) −0.005 (0.035) −0.014 (0.034) 0.000 (0.029)
Table 13. Placebo test ‑ change breakpoint location
Age range
±1 ±2 ±3 ±4
Impact of age >55 on receiving pension 0.063 (0.023) 0.086 (0.016) 0.092* (0.013) 0.099** (0.012)
Impact of receiving pension on household consumption 0.767 (1.116) −0.335 (0.594) −0.084 (0.453) −0.096 (0.371)
Sample size 744 1245 1808 2358
±1 ±2 ±3 ±4
Impact of age >65 on receiving pension −0.005 (0.014) 0.006 (0.011) 0.018* (0.010) 0.055*** (0.009)
Impact of receiving pension on household consumption 10.196 (30.595) −7.030 (16.007) −2.344 (2.535) −1.156* (0.649)
Sample size 1124 1806 2503 3167
Notes: *p<0.1; **p<0.05; ***p<0.01.
Table 14. Results of placebo test after excluding samples near breakpoints
Age range
±1 ±2 ±3 ±4
Impact of age >60 on receiving pension 0.646*** (0.030) 0.709*** (0.020) 0.736*** (0.016) 0.752*** (0.013)
Impact of receiving pension on household consumption −0.349*** (0.118) −0.361*** (0.075) −0.306*** (0.061) −0.299*** (0.052)
Sample size 670 1324 1922 2532
Notes: *p<0.1; **p<0.05; ***p<0.01.
Volume 11 Issue 5 (2025) 114 https://doi.org/10.36922/ijps.4857