
Page 54 - IJPS-2-2
P. 54
Latent class models for cross-national comparisons: the association between individual and national-level fertility and partnership characteristics
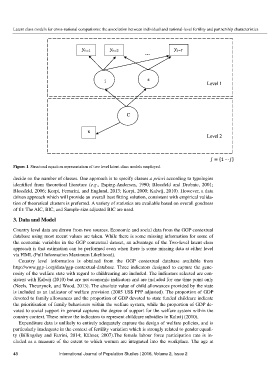
Figure 1. Structural equation representation of two level latent class models employed.
decide on the number of classes. One approach is to specify classes a priori according to typologies
identified from theoretical literature (e.g., Esping-Andersen, 1990; Blossfeld and Drobnic, 2001;
Blossfeld, 2006; Korpi, Ferrarini, and Englund, 2013; Korpi, 2000; Kalwij, 2010). However, a data
driven approach which will provide an overall best fitting solution, consistent with empirical valida-
tion of theoretical clusters is preferred. A variety of statistics are available based on overall goodness
of fit: The AIC, BIC, and Sample-size adjusted BIC are used.
3. Data and Model
Country level data are drawn from two sources. Economic and social data from the GGP contextual
database using most recent values are taken. While there is some missing information for some of
the economic variables in the GGP contextual dataset, an advantage of the Two-level latent class
approach is that estimation can be performed even when there is some missing data at either level
via FIML (Full Information Maximum Likelihood).
Country level information is obtained from the GGP contextual database available from
http://www.ggp-i.org/data/ggp-contextual-database. Three indicators designed to capture the gene-
rosity of the welfare state with regard to childrearing are included. The indicators selected are con-
sistent with Kalwij (2010) but are not economic indicators and are included for one time point only
(Neels, Theunynck, and Wood, 2013). The absolute value of child allowances provided by the state
is included as an indicator of welfare provision (2005 US$ PPP adjusted). The proportion of GDP
devoted to family allowances and the proportion of GDP devoted to state funded childcare indicate
the prioritisation of family behaviours within the welfare system, while the proportion of GDP de-
voted to social support in general captures the degree of support for the welfare system within the
country context. These mirror the indicators to represent childcare subsidies in Kalwij (2010).
Expenditure data is unlikely to entirely adequately capture the design of welfare policies, and is
particularly inadequate in the context of fertility variation which is strongly related to gender equali-
ty (Billingsley and Farrini, 2014; Kühner, 2007).The female labour force participation rate is in-
cluded as a measure of the extent to which women are integrated into the workplace. The age at
48 International Journal of Population Studies | 2016, Volume 2, Issue 2