
Page 86 - IJPS-2-2
P. 86
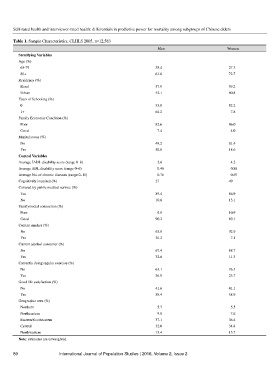
Self-rated health and interviewer-rated health: differentials in predictive power for mortality among subgroups of Chinese elders

       Table 1. Sample Characteristics, CLHLS 2005, n=12,583
                                                                    Men                           Women
         Stratifying Variables
         Age (%)
          65-79                                                    38.4                           27.3
          80+                                                      61.6                           72.7
         Residency (%)
          Rural                                                    57.9                           59.2
          Urban                                                    42.1                           40.8
         Years of Schooling (%)
          0                                                        35.8                           82.2
          1+                                                       64.2                            7.8
         Family Economic Condition (%)
          Poor                                                     82.6                           86.0
          Good                                                      7.4                            4.0
         Marital status (%)
          No                                                          49.2                        81.4
          Yes                                                      50.8                           18.6
         Control Variables
         Average IADL disability score (range 0–8)                  2.6                            4.2
         Average ADL disability score (range 0–6)                   0.46                           0.88
         Average No. of chronic diseases (range 0–11)               0.76                           0.69
         Cognitively impaired (%)                                  27                             49
         Covered by public medical service (%)
          Yes                                                      89.4                           86.9
          No                                                       10.6                           13.1
         Family/social connection (%)
          Poor                                                      9.8                           10.9
          Good                                                     90.2                           89.1
         Current smoker (%)
          No                                                       63.8                           92.9
          Yes                                                      36.2                            7.1
         Current alcohol consumer (%)
          No                                                       67.4                           88.7
          Yes                                                      32.6                           11.3
         Currently doing regular exercise (%)
          No                                                       63.1                           76.3
          Yes                                                      36.9                           23.7
         Good life satisfaction (%)
          No                                                       41.6                           41.1
          Yes                                                      58.4                           58.9
         Geographic area (%)
          Northern                                                  5.7                            5.5
          Northeastern                                              9.8                            7.6
          Eastern/Southeastern                                     37.1                           36.4
          Central                                                  32.0                           34.8
          Northwestern                                             15.4                           15.7
         Note: estimates are unweighted.


       80                 International Journal of Population Studies | 2016, Volume 2, Issue 2