
Page 87 - IJPS-2-2
P. 87
Haiyan Zhu, Qiushi Feng, and Danan Gu
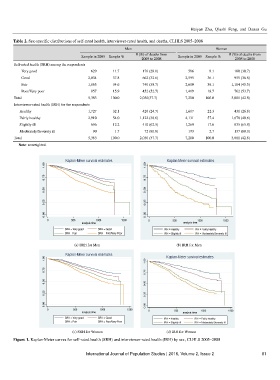
Table 2. Sex-specific distributions of self-rated health, interviewer-rated health, and deaths, CLHLS 2005–2008
Men Women
# (%) of deaths from # (%) of deaths from
Sample in 2005 Sample % 2005 to 2008 Sample in 2005 Sample % 2005 to 2008
Self-rated health (SRH) among the respondents
Very good 629 11.7 176 (28.0) 586 8.1 180 (30.7)
Good 2,034 37.8 662 (32.6) 2,595 36.1 955 (36.8)
Fair 1,863 34.6 740 (39.7) 2,600 36.1 1,184 (45.5)
Poor/Very poor 857 15.9 452 (52.7) 1,419 19.7 762 (53.7)
Total 5,383 100.0 2,030(37.7) 7,200 100.0 3,081 (42.8)
Interviewer-rated health (IRH) for the respondents
Healthy 1,727 32.1 426 (24.7) 1,607 22.3 431 (26.8)
Fairly healthy 2,910 54.0 1,122 (38.6) 4,131 57.4 1,678 (40.6)
Slightly ill 656 12.2 410 (62.5) 1,269 17.6 835 (65.8)
Moderately/Severely ill 90 1.7 72 (80.0) 193 2.7 137 (80.0)
Total 5,383 100.0 2,030 (37.7) 7,200 100.0 3,081 (42.8)
Note: unweighted.
Kaplan-Meier survival estimates
1.00
0.75
0.50
0.25
0.00
0 500 1000 1500
analysis time
SRH = Very good SRH = Good
SRH = Fair SRH = Poor/Very Poor
(a) SRH for Men (b) IRH for Men
Kaplan-Meier survival estimates
1.00
0.75
0.50
0.25
0.00
0 500 1000 1500
analysis time
SRH = Very good SRH = Good
SRH = Fair SRH = Poor/Very Poor
(c) SRH for Women (d) IRH for Women
Figure 1. Kaplan-Meier curves for self-rated health (SRH) and interviewer-rated health (IRH) by sex, CLHLS 2005–2008
International Journal of Population Studies | 2016, Volume 2, Issue 2 81