
Page 91 - IJPS-2-2
P. 91
Haiyan Zhu, Qiushi Feng, and Danan Gu
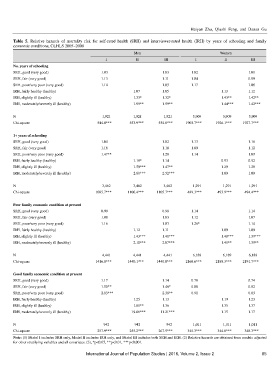
Table 5. Relative hazards of mortality risk for self-rated health (SRH) and interviewer-rated health (IRH) by years of schooling and family
economic conditions, CLHLS 2005–2008
Men Women
I II III I II III
No. years of schooling
SRH, good (very good) 1.03 1.03 1.02 1.01
SRH, fair (very good) 1.13 1.11 1.04 0.99
SRH, poor/very poor (very good) 1.14 1.03 1.17 1.06
IRH, fairly healthy (healthy) 1.07 1.05 1.13 1.12
IRH, slightly ill (healthy) 1.33* 1.32* 1.43** 1.42**
IRH, moderately/severely ill (healthy) 1.99** 1.99** 1.44*** 1.42***
N 1,921 1,921 1,921 5,909 5,909 5,909
Chi-square 544.0*** 553.9*** 554.8*** 1903.7*** 1926.1*** 1927.7***
1+ years of schooling
SRH, good (very good) 1.04 1.02 1.13 1.16
SRH, fair (very good) 1.16 1.10 1.09 1.12
SRH, poor/very poor (very good) 1.47** 1.28 1.14 1.09
IRH, fairly healthy (healthy) 1.18* 1.14 0.93 0.92
IRH, slightly ill (healthy) 1.59*** 1.47** 1.29 1.28
IRH, moderately/severely ill (healthy) 2.80*** 2.52*** 1.09 1.09
N 3,462 3,462 3,462 1,291 1,291 1,291
Chi-square 1085.7*** 1100.4*** 1105.7*** 489.3*** 493.9*** 494.4***
Poor family economic condition at present
SRH, good (very good) 0.99 0.98 1.14 1.14
SRH, fair (very good) 1.08 1.03 1.12 1.07
SRH, poor/very poor (very good) 1.16 1.03 1.26* 1.14
IRH, fairly healthy (healthy) 1.12 1.11 1.09 1.09
IRH, slightly ill (healthy) 1.43*** 1.41*** 1.40*** 1.39***
IRH, moderately/severely ill (healthy) 2.10*** 2.07*** 1.41** 1.39**
N 4,441 4,441 4,441 6,189 6,189 6,189
Chi-square 1416.8*** 1440.1*** 1440.8*** 2166.6*** 2188.3*** 2191.7***
Good family economic condition at present
SRH, good (very good) 1.17 1.14 0.78 0.74
SRH, fair (very good) 1.50** 1.46* 0.88 0.82
SRH, poor/very poor (very good) 2.83*** 2.38** 0.91 0.83
IRH, fairly healthy (healthy) 1.25 1.13 1.19 1.23
IRH, slightly ill (healthy) 1.81** 1.36 1.35 1.37
IRH, moderately/severely ill (healthy) 19.66*** 11.21*** 1.15 1.17
N 942 942 942 1,011 1,011 1,011
Chi-square 257.9*** 255.2*** 267.9*** 345.3*** 344.8*** 348.3***
Note: (1) Model I includes SRH only, Model II includes IRH only, and Model III includes both SRH and IRH. (2) Relative hazards are obtained from models adjusted
for other stratifying variables and all covariates. (3), *p<0.05, **p<0.01, ***p<0.001.
International Journal of Population Studies | 2016, Volume 2, Issue 2 85