
Page 88 - IJPS-2-2
P. 88
Self-rated health and interviewer-rated health: differentials in predictive power for mortality among subgroups of Chinese elders
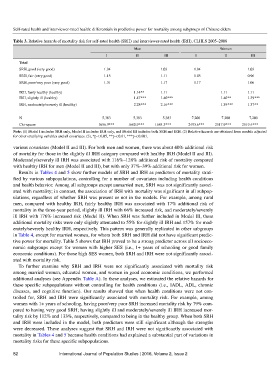
Table 3. Relative hazards of mortality risk for self-rated health (SRH) and interviewer-rated health (IRH), CLHLS 2005–2008
Men Women
I II III I II III
Total
SRH, good (very good) 1.04 1.03 1.04 1.03
SRH, fair (very good) 1.15 1.11 1.05 0.96
SRH, poor/very poor (very good) 1.31 1.17 1.17 1.06
IRH, fairly healthy (healthy) 1.14** 1.11 1.11 1.11
IRH, slightly ill (healthy) 1.47*** 1.40*** 1.40** 1.39***
IRH, moderately/severely ill (healthy) 2.28*** 2.16*** 1.39*** 1.37**
N 5,383 5,383 5,383 7,200 7,200 7,200
Chi-square 1656.9*** 1680.9*** 1684.3*** 2493.6*** 2517.9*** 2519.4***
Note: (1) Model I includes SRH only, Model II includes IRH only, and Model III includes both SRH and IRH. (2) Relative hazards are obtained from models adjusted
for other stratifying variables and all covariates. (3), *p < 0.05, **p < 0.01, ***p < 0.001.
various covariates (Model II and III). For both men and women, there was about 40% additional risk
of mortality for those in the slightly ill IRH category compared with healthy IRH (Model II and III).
Moderately/severely ill IRH was associated with 116%–128% additional risk of mortality compared
with healthy IRH for men (Model II and III), but with only 37%–39% additional risk for women.
Results in Tables 4 and 5 show further models of SRH and IRH as predictors of mortality strati-
fied by various subpopulations, controlling for a number of covariates including health conditions
and health behavior. Among all subgroups except unmarried men, SRH was not significantly associ-
ated with mortality; in contrast, the association of IRH with mortality was significant in all subpop-
ulations, regardless of whether SRH was present or not in the models. For example, among rural
men, compared with healthy IRH, fairly healthy IRH was associated with 17% additional risk of
mortality in the three-year period, slightly ill IRH with 66% increased risk, and moderately/severely
ill IRH with 176% increased risk (Model II). When SRH was further included in Model III, these
additional mortality risks were only slightly attenuated to 55% for slightly ill IRH and 157% for mod-
erately/severely healthy IRH, respectively. This pattern was generally replicated in other subgroups
in Table 4, except for married women, for whom both SRH and IRH did not have significant predic-
tive power for mortality. Table 5 shows that IRH proved to be a strong predictor across all socioeco-
nomic subgroups except for women with higher SES (i.e., 1+ years of schooling or good family
economic conditions). For those high SES women, both SRH and IRH were not significantly associ-
ated with mortality risk.
To further examine why SRH and IRH were not significantly associated with mortality risk
among married women, educated women, and women in good economic conditions, we performed
additional analyses (see Appendix Table A). In these analyses, we estimated the relative hazards for
these specific subpopulations without controlling for health conditions (i.e., IADL, ADL, chronic
diseases, and cognitive function). Our results showed that when health conditions were not con-
trolled for, SRH and IRH were significantly associated with mortality risk. For example, among
women with 1+ years of schooling, having poor/very poor SRH increased mortality risk by 79% com-
pared to having very good SRH; having slightly ill and moderately/severely ill IRH increased mor-
tality risk by 112% and 133%, respectively, compared to being in the healthy group. When both SRH
and IRH were included in the model, both predictors were still significant although the strengths
were decreased. These analyses suggest that SRH and IRH were not significantly associated with
mortality in Tables 4 and 5 because health conditions had explained a substantial part of variations in
mortality risks for these specific subpopulations.
82 International Journal of Population Studies | 2016, Volume 2, Issue 2