
Page 48 - IJPS-5-1
P. 48
Associates and employment among Ugandan young migrants
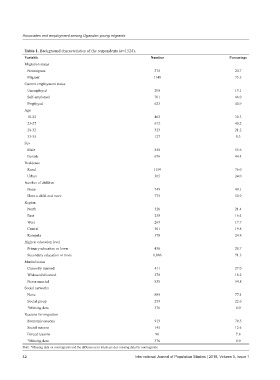
Table 1. Background characteristics of the respondents (n=1524).
Variable Number Percentage
Migration status
Nonmigrant 376 24.7
Migrant 1148 75.3
Current employment status
Unemployed 200 13.1
Self-employed 701 46.0
Employed 623 40.9
Age
18-22 462 30.3
23-27 612 40.2
28-32 323 21.2
33-35 127 8.3
Sex
Male 848 55.6
Female 676 44.4
Residence
Rural 1159 76.0
Urban 365 24.0
Number of children
None 749 49.1
Have a child and more 775 50.9
Region
North 326 21.4
East 250 16.4
West 269 17.7
Central 301 19.8
Kampala 378 24.8
Highest education level
Primary education or lower 438 28.7
Secondary education or more 1,086 71.3
Marital status
Currently married 411 27.0
Widowed/divorced 278 18.2
Never married 835 54.8
Social networks
None 889 77.4
Social group 259 22.6
*Missing data 376 0.0
Reasons for migration
Economic reasons 913 79.5
Social reasons 145 12.6
Forced reasons 90 7.8
*Missing data 376 0.0
Note: *Missing data on nonmigrants and the differences in totals are due missing data for nonmigrants.
42 International Journal of Population Studies | 2019, Volume 5, Issue 1