
Page 50 - IJPS-5-1
P. 50
Associates and employment among Ugandan young migrants
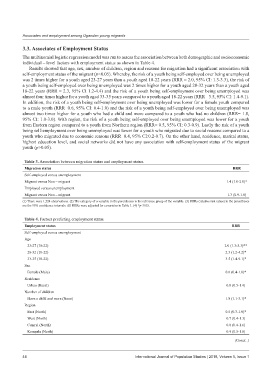
3.3. Associates of Employment Status
The multinomial logistic regression model was run to assess the association between both demographic and socioeconomic
individual – level factors with employment status as shown in Table 4.
Results showed that age, sex, number of children, region and reasons for migration had a significant association with
self-employment status of the migrant (p<0.05). Whereby, the risk of a youth being self-employed over being unemployed
was 2 times higher for a youth aged 23-27 years than a youth aged 18-22 years (RRR = 2.0, 95% CI: 1.3-3.3), the risk of
a youth being self-employed over being unemployed was 2 times higher for a youth aged 28-32 years than a youth aged
18-22 years (RRR = 2.3, 95% CI 1.2-4.4) and the risk of a youth being self-employment over being unemployed was
almost four times higher for a youth aged 33-35 years compared to a youth aged 18-22 years (RRR= 3.5, 95% CI: 1.4-9.1).
In addition, the risk of a youth being self-employment over being unemployed was lower for a female youth compared
to a male youth (RRR=0.6, 95% CI: 0.4-1.0) and the risk of a youth being self-employed over being unemployed was
almost two times higher for a youth who had a child and more compared to a youth who had no children (RRR= 1.8,
95% CI: 1.0-3.0). With region, the risk of a youth being self-employed over being unemployed was lower for a youth
from Eastern region compared to a youth from Northern region (RRR= 0.5, 95% CI: 0.3-0.9). Lastly the risk of a youth
being self-employment over being unemployed was lower for a youth who migrated due to social reasons compared to a
youth who migrated due to economic reasons (RRR=0.4, 95% CI:0.2-0.7). On the other hand, residence, marital status,
highest education level, and social networks did not have any association with self-employment status of the migrant
youth (p>0.05).
Table 3. Association between migration status and employment status.
Migration status RRR
Self-employed versus unemployment
Migrant versus Non – migrant 1.4 (1.0-2.0)*
Employed versus unemployment
Migrant versus Non – migrant 1.3 (0.9-1.8)
(1) There were 1,524 observations. (2) The category of a variable in the parentheses is the reference group of the variable. (3) RRRs (relative risk ratios) in the parentheses
are the 95% confidence intervals. All RRRs were adjusted for covariates in Table 1. (4) *p<0.05.
Table 4. Factors predicting employment status.
Employment status RRR
Self-employed versus unemployment
Age
23-27 (18-22) 2.0 (1.3-3.3)**
28-32 (18-22) 2.3 (1.2-4.2)*
33-35 (18-22) 3.5 (1.4-9.1)*
Sex
Female (Male) 0.6 (0.4-1.0)*
Residence
Urban (Rural) 0.8 (0.5-1.4)
Number of children
Have a child and more (None) 1.8 (1.1-3.1)*
Region
East (North) 0.5 (0.3-1.0)*
West (North) 0.7 (0.4-1.3)
Central (North) 0.8 (0.4-1.6)
Kampala (North) 0.9 (0.5-1.8)
(Contd...)
44 International Journal of Population Studies | 2019, Volume 5, Issue 1