
Page 104 - IJPS-8-1
P. 104
International Journal of
Population Studies Fertility by parity in China
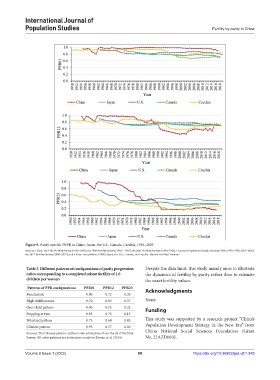
Figure 9. Parity-specific PPPR in China, Japan, the U.S., Canada, Czechia, 1950–2020
Sources: China: The 1982 Fertility Survey (1949–1981), the 1988 Fertility Survey (1982 – 1987), the 2001 Fertility Surveys (1990–1994), Censuses/ Population Sample Surveys (1989, 1995–1999, 2018–2020),
the 2017 Fertility Survey (2000–2017), and a linear interpolation (1988). Japan, the U.S., Canada, and Czechia: Human Fertility Database.
Table 3. Different patterns of configurations of parity progression Despite the data limit, this study mainly aims to illustrate
ratios corresponding to a completed cohort fertility of 1.6 the dynamics of fertility by parity rather than to estimate
children per woman the exact fertility values.
Patterns of PPR configurations PPR01 PPR12 PPR23 Acknowledgments
Benchmark 0.80 0.72 0.30
High childlessness 0.70 0.85 0.37 None.
One-child pattern 0.90 0.55 0.32 Funding
Stopping at two 0.85 0.75 0.15
Polarized pattern 0.75 0.68 0.45 This study was supported by a research project “China’s
Chinese pattern 0.95 0.57 0.20 Population Development Strategy in the New Era” from
China National Social Sciences Foundation (Grant
Sources: The Chinese pattern: authors’ own estimations from the 2017 Fertility
Survey. All other patterns are estimations made by Zeman et al. (2018). No. 22AZD083).
Volume 8 Issue 1 (2022) 98 https://doi.org/10.36922/ijps.v8i1.348