
Page 99 - IJPS-8-1
P. 99
International Journal of
Population Studies Fertility by parity in China
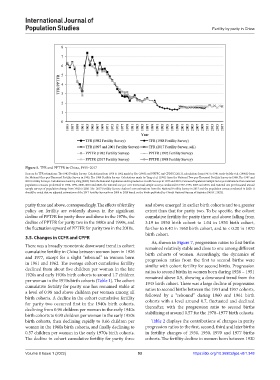
Figure 5. TFR and PPTFR in China, 1955–2017
Sources for TFR estimations: The 1982 Fertility Survey: Calculations from 1950 to 1962 made by Yao (1995) and NPFPC and CPDRC (2013), calculations from 1963 to 1981 made by Ma et al. (1986b) from
the National One-per-Thousand Fertility Survey in 1982; The 1988 Fertility Survey: Calculations made by Yang et al. (1991) from the National Two-per-Thousand Fertility Survey in 1988; The 1997 and
2001 Fertility Surveys: Calculations made by Ding (2003) from the National Population and Reproductive Health Surveys in 1997 and 2001; Censuses/Population Sample Surveys: Estimations from national
population censuses performed in 1982, 1990, 2000, 2010 and 2020, the national one per cent intercensal sample surveys conducted in 1987, 1995, 2005 and 2015, and national one per thousand annual
sample surveys of population change from 1982 to 2020 ;The 2017 Fertility Survey: Authors’ own estimations from the National Fertility Survey in 2017 and the population census conducted in 2020. It
should be noted that we adjusted estimations of the 2017 Fertility Survey from 2000 to 2020 based on the births published by China’s National Bureau of Statistics (NBSC, 2022).
parity three and above, correspondingly. The effects of fertility and above emerged in earlier birth cohorts and to a greater
policy on fertility are evidently shown in the significant extent than that for parity two. To be specific, the cohort
decline of PPTFR for parity three and above in the 1970s, the cumulative fertility for parity three and above falling from
decline of PPTFR for parity two in the 1980s and 1990s, and 3.19 in 1930 birth cohort to 1.04 in 1950 birth cohort,
the fluctuation upward of PPTFR for parity two in the 2010s. further to 0.40 in 1960 birth cohort, and to < 0.20 in 1970
birth cohort.
3.5. Changes in CCFR and CPPR
As, shown in Figure 7, progression ratios to first births
There was a broadly monotonic downward trend in cohort remained relatively stable and close to one among different
cumulative fertility in China between women born in 1926 birth cohorts of women. Accordingly, the dynamics of
and 1977, except for a slight “rebound” in women born progression ratios from the first to second births were
in 1961 and 1962. The average cohort cumulative fertility similar with cohort fertility for second births. Progression
declined from about five children per woman in the late ratios to second births in women born during 1926 – 1951
1920s and early 1930s birth cohorts to around 1.7 children remained above 0.9, showing a downward trend from the
per woman in the 1970s birth cohorts (Table 1). The cohort 1945 birth cohort. There was a large decline of progression
cumulative fertility for parity one has remained stable at ratios to second births between the 1951 and 1957 cohorts,
a level of 0.98 and above children per woman among all
birth cohorts. A decline in the cohort cumulative fertility followed by a “rebound” during 1960 and 1961 birth
cohorts with a level around 0.7, fluctuated and declined
for parity two occurred first in the 1940s birth cohorts,
declining from 0.96 children per woman in the early 1940s thereafter, with the progression ratio to second births
birth cohorts to 0.90 children per woman in the early 1950s stabilizing at around 0.57 for the 1970–1977 birth cohorts.
birth cohorts, then declining rapidly to 0.66 children per Table 2 displays the contributions of changes in parity
woman in the 1960s birth cohorts, and finally declining to progression ratios to the first, second, third and later births
0.57 children per woman in the early 1970s birth cohorts. in fertility changes of 1930, 1950, 1970 and 1977 births
The decline in cohort cumulative fertility for parity three cohorts. The fertility decline in women born between 1930
Volume 8 Issue 1 (2022) 93 https://doi.org/10.36922/ijps.v8i1.348