
Page 94 - IJPS-8-1
P. 94
International Journal of
Population Studies Fertility by parity in China
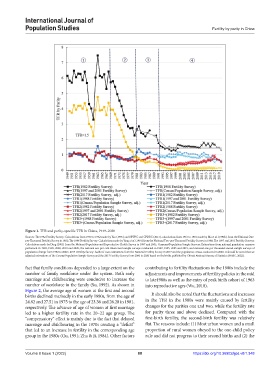
Figure 1. TFR and parity-specific TFR in China, 1949–2020
Sources: The 1982 Fertility Survey: Calculations from 1950 to 1962 made by Yao (1995) and NPFPC and CPDRC (2013), calculations from 1963 to 1981 made by Ma et al. (1986b) from the National One-
per-Thousand Fertility Survey in 1982; The 1988 Fertility Survey: Calculations made by Yang et al. (1991) from the National Two-per-Thousand Fertility Survey in 1988; The 1997 and 2001 Fertility Surveys:
Calculations made by Ding (2003) from the National Population and Reproductive Health Survey in 1997 and 2001; Censuses/Population Sample Surveys: Estimations from national population censuses
performed in 1982, 1990, 2000, 2010 and 2020, the national one per cent intercensal sample surveys conducted in 1987, 1995, 2005 and 2015, and national one per thousand annual sample surveys of
population change from 1982 to 2020 ; 2017 Fertility Survey: Authors’ own estimations from the National Fertility Survey in 2017 and the population census conducted in 2020. It should be noted that we
adjusted estimations of the Census/Population Sample Survey and the 2017 Fertility Survey from 2000 to 2020 based on the births published by China’s National Bureau of Statistics (NBSC, 2022).
fact that family conditions depended to a large extent on the contributing to fertility fluctuations in the 1980s include the
number of family workforce under the system. Both early adjustments and improvements of fertility policies in the mid
marriage and childbearing were conducive to increase the to late1980s as well as the entry of peak birth cohort of 1963
number of workforce in the family (Su, 1992). As shown in into reproductive ages (Wu, 2010).
Figure 2, the average age of women at the first and second
births declined markedly in the early 1980s, from the age of It should also be noted that the fluctuations and increases
24.82 and 27.51 in 1975 to the age of 23.36 and 26.28 in 1981, in the TFR in the 1980s were mainly caused by fertility
respectively. The advance of age of women at first marriage changes for the parities one and two, while the fertility rate
led to a higher fertility rate in the 20–22 age group. The for parity three and above declined. Compared with the
“compensatory” effect is mainly due to the fact that delayed first-birth fertility, the second-birth fertility was relatively
marriage and childbearing in the 1970s creating a “deficit” flat. The reasons include: (1) Most urban women and a small
that led to an increase in fertility in the corresponding age proportion of rural women obeyed to the one-child policy
group in the 1980s (Gu, 1991; Zha & Ji, 1984). Other factors rule and did not progress to their second births and (2) the
Volume 8 Issue 1 (2022) 88 https://doi.org/10.36922/ijps.v8i1.348