
Page 98 - IJPS-8-1
P. 98
International Journal of
Population Studies Fertility by parity in China
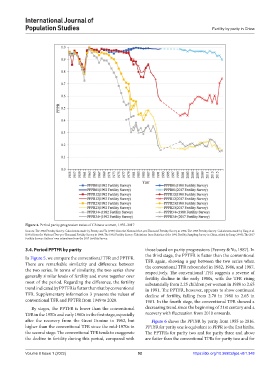
Figure 4. Period parity progression ratios of Chinese women, 1955–2017
Sources: The 1982 Fertility Survey: Calculations made by Feeney and Yu (1987) from the National One-per-Thousand Fertility Survey in 1982; The 1988 Fertility Survey: Calculations made by Yang et al.
(1991) from the National Two-per-Thousand Fertility Survey in 1988; The 1992 Fertility Survey: Tabulations from Statistics of the 1992 Fertility Sampling Survey in China, edited by Jiang (1995); The 2017
Fertility Survey: Authors’ own estimations from the 2017 Fertility Survey.
3.4. Period PPTFR by parity those based on parity progressions (Feeney & Yu, 1987). In
the third stage, the PPTFR is flatter than the conventional
In Figure 5, we compare the conventional TFR and PPTFR. TFR again, showing a gap between the two series when
There are remarkable similarity and difference between the conventional TFR rebounded in 1982, 1986, and 1987,
the two series. In terms of similarity, the two series show respectively. The conventional TFR suggests a reverse of
generally similar levels of fertility and move together over fertility decline in the early 1980s, with the TFR rising
most of the period. Regarding the difference, the fertility substantially from 2.25 children per woman in 1980 to 2.65
trend indicated by PPTFR is flatter than that by conventional in 1981. The PPTFR, however, appears to show continued
TFR. Supplementary information 3 presents the values of decline of fertility, falling from 2.70 in 1980 to 2.65 in
conventional TFR and PPTFR from 1949 to 2020. 1981. In the fourth stage, the conventional TFR showed a
By stages, the PPTFR is lower than the conventional decreasing trend since the beginning of 21st century and a
TFR in the 1950s and early 1960s in the first stage, especially recovery with fluctuation from 2010 onwards.
after the recovery from the Great Famine in 1962, but Figure 6 shows the PPTFR by parity from 1955 to 2016.
higher than the conventional TFR since the mid-1970s in PPTFR for parity one is equivalent to PPPR to the first births.
the second stage. The conventional TFR tends to exaggerate The PPTFRs for parity two and for parity three and above
the decline in fertility during this period, compared with are flatter than the conventional TFRs for parity two and for
Volume 8 Issue 1 (2022) 92 https://doi.org/10.36922/ijps.v8i1.348