
Page 101 - IJPS-8-1
P. 101
International Journal of
Population Studies Fertility by parity in China
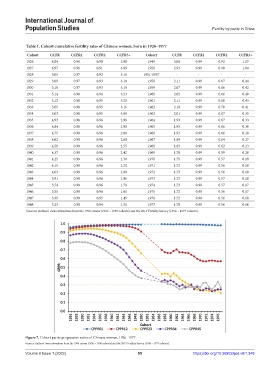
Table 1. Cohort cumulative fertility rates of Chinese women, born in 1926–1977
Cohort CCFR CCFR1 CCFR2 CCFR3+ Cohort CCFR CCFR1 CCFR2 CCFR3+
1926 4.84 0.96 0.90 2.98 1949 3.08 0.99 0.92 1.17
1927 4.97 0.96 0.91 3.09 1950 2.93 0.99 0.90 1.04
1928 5.05 0.97 0.92 3.16 1951-1957 - - - -
1929 5.09 0.97 0.93 3.19 1958 2.11 0.99 0.67 0.44
1930 5.10 0.97 0.93 3.19 1959 2.07 0.99 0.66 0.42
1931 5.14 0.98 0.94 3.23 1960 2.05 0.99 0.66 0.40
1932 5.12 0.98 0.95 3.20 1961 2.11 0.99 0.68 0.43
1933 5.09 0.98 0.95 3.16 1962 2.10 0.99 0.70 0.41
1934 5.03 0.98 0.95 3.09 1963 2.01 0.99 0.67 0.35
1935 4.93 0.98 0.96 2.99 1964 1.99 0.99 0.67 0.33
1936 4.84 0.98 0.96 2.90 1965 1.95 0.99 0.66 0.30
1937 4.75 0.99 0.96 2.80 1966 1.93 0.99 0.66 0.28
1938 4.62 0.99 0.96 2.68 1967 1.89 0.99 0.64 0.27
1939 4.50 0.99 0.96 2.55 1968 1.83 0.99 0.62 0.23
1940 4.37 0.99 0.96 2.42 1969 1.78 0.99 0.59 0.20
1941 4.25 0.99 0.96 2.30 1970 1.75 0.99 0.57 0.19
1942 4.15 0.99 0.96 2.20 1971 1.73 0.99 0.56 0.18
1943 4.03 0.99 0.96 2.08 1972 1.73 0.99 0.56 0.18
1944 3.91 0.99 0.96 1.96 1973 1.73 0.99 0.57 0.18
1945 3.74 0.99 0.96 1.79 1974 1.73 0.98 0.57 0.17
1946 3.55 0.99 0.96 1.61 1975 1.72 0.98 0.56 0.17
1947 3.39 0.99 0.95 1.45 1976 1.72 0.98 0.56 0.18
1948 3.23 0.99 0.94 1.31 1977 1.70 0.98 0.56 0.16
Sources: Authors’ own estimations from the 1990 census (1926 – 1950 cohorts) and the 2017 Fertility Survey (1958 – 1977 cohorts).
Figure 7. Cohort parity progression ratios of Chinese women, 1926–1977
Sources: Authors’ own estimations from the 1990 census (1926 – 1950 cohorts) and the 2017 Fertility Survey (1958 – 1977 cohorts).
Volume 8 Issue 1 (2022) 95 https://doi.org/10.36922/ijps.v8i1.348