
Page 97 - IJPS-8-1
P. 97
International Journal of
Population Studies Fertility by parity in China
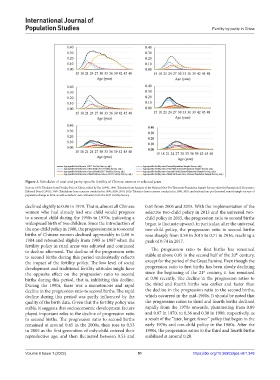
Figure 3. Schedules of total and parity-specific fertility of Chinese women in selected years
Sources: 1970: Tabulates from Fertility Data of China, edited by Yao (1995); 1980: Tabulates from Analysis of the National One-Per-Thousand-Population Sample Survey, edited by Population & Economics
Editorial Board (1983); 1989: Tabulations from censuses conducted in 1990; 2000, 2010, 2016: Tabulates from censuses conducted in 2000, 2010, and national one per thousand annual sample surveys of
population change in 2016, as well as authors’ own estimation from the 2017 Fertility Survey.
declined slightly to 0.96 in 1979. That is, almost all Chinese 0.61 from 2005 and 2015. With the implementation of the
women who had already had one child would progress selective two-child policy in 2013 and the universal two-
to a second child during the 1950s to 1970s, indicating a child policy in 2015, the progression ratio to second births
widespread birth of two children. Since the introduction of began to fluctuate upward. In particular, after the universal
the one-child policy in 1980, the progression ratio to second two-child policy, the progression ratio to second births
births of Chinese women declined appreciably to 0.80 in rose sharply from 0.54 in 2015 to 0.71 in 2016, reaching a
1984 and rebounded slightly from 1985 to 1987 when the peak of 0.74 in 2017.
fertility policy in rural areas was adjusted and continued
to decline afterward. The decline of the progression ratio The progression ratio to first births has remained
th
to second births during this period undoubtedly reflects stable at above 0.95 in the second half of the 20 century,
the impact of the fertility policy. The low level of social except for the period of the Great Famine. Even though the
development and traditional fertility attitudes might have progression ratio to first births has been slowly declining
st
the opposite effect on the progression ratio to second since the beginning of the 21 century, it has remained
births during this period, that is, inhibiting this decline. at 0.90 recently. The decline in the progression ratios to
During the 1990s, there was a monotonous and rapid the third and fourth births was earlier and faster than
decline in the progression ratio to second births. The rapid the decline in the progression ratio to the second births,
decline during this period was partly influenced by the which occurred in the mid-1960s. It should be noted that
quality of the birth data. Given that the fertility policy was the progression ratios to third and fourth births declined
stable, it suggests that socioeconomic development factors rapidly from the 1970s onwards, plummeting from 0.89
played important roles to the decline of progression ratio and 0.87 in 1970, to 0.36 and 0.30 in 1990, respectively, as
to second births. The progression ratio to second births a result of the “later, longer, fewer” policy that began in the
remained at around 0.45 in the 2000s, then rose to 0.53 early 1970s and one-child policy in the 1980s. After the
in 2005 as the first generation of only-child entered their 1990s, the progression ratios to the third and fourth births
reproductive age, and then fluctuated between 0.53 and stabilized at around 0.20.
Volume 8 Issue 1 (2022) 91 https://doi.org/10.36922/ijps.v8i1.348