
Page 100 - IJPS-8-1
P. 100
International Journal of
Population Studies Fertility by parity in China
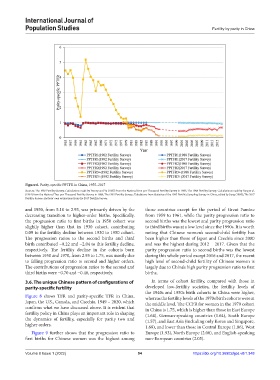
Figure 6. Parity-specific PPTFR in China, 1955–2017
Sources: The 1982 Fertility Survey: Calculations made by Feeney and Yu (1987) from the National One-per-Thousand Fertility Survey in 1982; The 1988 Fertility Survey: Calculations made by Yang et al.
(1991) from the National Two-per-Thousand Fertility Survey in 1988; The 1992 Fertility Survey: Tabulations from Statistics of the 1992 Fertility Sampling Survey in China, edited by Jiang (1995); The 2017
Fertility Survey: Authors’ own estimations from the 2017 Fertility Survey.
and 1950, from 5.10 to 2.93, was primarily driven by the those countries except for the period of Great Famine
decreasing transition to higher-order births. Specifically, from 1959 to 1961, while the parity progression ratio to
the progression ratio to first births in 1950 cohort was second births was the lowest and parity progression ratio
slightly higher than that in 1930 cohort, contributing to third births was at a low level since the 1990s. It is worth
0.09 to the fertility decline between 1930 to 1950 cohort. noting that Chinese women’s second-child fertility has
The progression ratios to the second births and third been higher than those of Japan and Czechia since 2000
birth contributed −0.22 and −2.04 to this fertility decline, and was the highest during 2012 – 2017. Given that the
respectively. The fertility decline in the cohorts born parity progression ratio to second births was the lowest
between 1950 and 1970, from 2.93 to 1.75, was mostly due during this whole period except 2016 and 2017, the recent
to falling progression ratio to second and higher orders. high level of second-child fertility of Chinese women is
The contributions of progression ratios to the second and largely due to China’s high parity progression ratio to first
third births were −0.70 and −0.48, respectively. births.
3.6. The unique Chinese pattern of configurations of In terms of cohort fertility, compared with those in
parity-specific fertility developed low-fertility societies, the fertility levels of
the 1940s and 1950s birth cohorts in China were higher,
Figure 8 shows TFR and parity-specific TFR in China, whereas the fertility levels of the 1970s birth cohorts were at
Japan, the U.S., Canada, and Czechia, 1949 – 2020, which the middle level. The CCFR for women in the 1970 cohort
confirms what we have discussed above. It is evident that in China is 1.75, which is higher than those in East Europe
fertility policy in China plays an important role in shaping (1.64), German-speaking countries (1.64), South Europe
the dynamics of fertility, especially for parity two and (1.57), and East Asia (including only Korea and Singapore,
higher orders. 1.68), and lower than those in Central Europe (1.86), West
Figure 9 further shows that the progression ratio to Europe (1.93), North Europe (2.00), and English-speaking
first births for Chinese women was the highest among non-European countries (2.05).
Volume 8 Issue 1 (2022) 94 https://doi.org/10.36922/ijps.v8i1.348