
Page 109 - IMO-2-2
P. 109
Innovative Medicines & Omics Modeling Aurora-B kinase inhibitors
Table 1. The fitness and activity data of training and test set Table 1. (Continued)
molecules
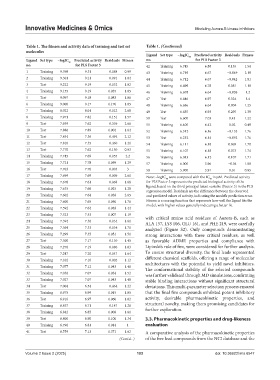
Ligand Set type −logIC 50 Predicted activity Residuals Fitness
Ligand Set type −logIC 50 Predicted activity Residuals Fitness no. for PLS Factor 3
no. for PLS Factor 3 42 Training 6.745 6.88 0.135 1.54
1 Training 9.398 9.31 −0.088 0.99 43 Training 6.719 6.67 −0.049 2.19
2 Training 9.301 9.21 −0.091 1.04 44 Training 6.712 6.67 −0.042 1.81
3 Test 9.222 9.19 −0.032 1.02 45 Training 6.699 6.78 0.081 1.18
4 Training 9.155 9.19 0.035 1.05 46 Training 6.678 6.64 −0.038 1.2
5 Test 9.097 9.18 0.083 1.06 47 Test 6.646 6.97 0.324 1.4
6 Training 9.000 9.17 0.170 1.05 48 Training 6.636 6.64 0.004 1.25
7 Training 8.022 8.01 −0.012 2.68 49 Test 6.635 6.93 0.295 1.39
8 Training 7.971 7.82 −0.151 1.57 50 Test 6.600 7.03 0.43 1.22
9 Test 7.959 7.62 −0.339 2.66 51 Training 6.400 6.42 0.02 0.49
10 Test 7.886 7.89 0.004 1.64 52 Training 6.312 6.16 −0.152 1.76
11 Test 7.854 7.36 −0.494 2.12 53 Test 6.232 6.14 −0.092 1.76
12 Test 7.810 7.35 −0.460 1.21 54 Training 6.111 6.18 0.069 1.78
13 Test 7.770 7.62 −0.150 0.93 55 Training 6.107 6.18 0.073 1.74
14 Training 7.745 7.69 −0.055 2.2 56 Training 6.013 6.12 0.107 1.71
15 Training 7.721 7.78 0.059 1.29 57 Training 6.000 5.96 −0.04 1.08
16 Test 7.703 7.70 −0.003 3 58 Training 5.900 5.91 0.01 0.95
17 Training 7.699 7.69 −0.009 2.61 Note: −logIC were computed with the IC in µM. Predicted activity
50
50
18 Training 7.678 7.61 −0.068 1.68 for PLS Factor 3 represents the predicted biological activity of the
19 Training 7.635 7.66 0.025 1.28 ligand, based on the third principal latent variable (Factor 3) in the PLS
regression model. Residuals are the difference between the observed
20 Training 7.602 7.64 0.038 2.65 and predicted values of activity, indicating the model’s prediction error.
21 Training 7.600 7.65 0.050 1.76 Fitness is a scoring function that represents how well the ligand fits the
model, with higher values generally indicating a better fit.
22 Training 7.592 7.64 0.048 1.44
23 Training 7.523 7.53 0.007 1.19
24 Training 7.394 7.36 −0.034 1.61 with critical amino acid residues of Aurora-B, such as
ALA 157, LYS 106, GLU 161, and PHE 219, were carefully
25 Training 7.364 7.33 −0.034 1.71 analyzed (Figure S2). Only compounds demonstrating
26 Training 7.299 7.35 0.051 1.51 strong interactions with these critical residues, as well
27 Test 7.300 7.17 −0.130 1.45 as favorable ADME properties and compliance with
28 Training 7.276 7.19 −0.086 1.03 Lipinski’s rule of five, were considered for further analysis.
29 Test 7.247 7.20 −0.047 1.64 To ensure structural diversity, the final leads represented
30 Training 7.102 7.10 −0.002 1.12 different chemical scaffolds, offering a range of molecular
31 Training 7.077 7.12 0.043 1.46 architectures with the potential to yield novel inhibitors.
The conformational stability of the selected compounds
32 Training 7.036 7.07 0.034 1.52 was further validated through MD simulations, confirming
33 Training 7.027 7.07 0.043 1.48 stable binding interactions without significant structural
34 Test 7.004 6.54 −0.464 1.22 deviations. This multi-parameter selection process ensured
35 Training 6.975 6.99 0.015 1.05 that the final five compounds exhibited potent inhibitory
36 Test 6.910 6.97 0.060 1.02 activity, desirable pharmacokinetic properties, and
37 Training 6.857 6.71 −0.147 1.26 structural novelty, making them promising candidates for
38 Training 6.842 6.85 0.008 1.61 further exploration.
39 Test 6.800 6.90 0.100 1.34 3.3. Pharmacokinetic properties and drug-likeness
40 Training 6.796 6.81 0.014 1 evaluation
41 Test 6.759 7.13 0.371 1.62 A comparative analysis of the pharmacokinetic properties
(Cont'd...) of the five lead compounds from the NCI database and the
Volume 2 Issue 2 (2025) 103 doi: 10.36922/imo.6547