
Page 112 - IMO-2-2
P. 112
Innovative Medicines & Omics Modeling Aurora-B kinase inhibitors
A B C
D E
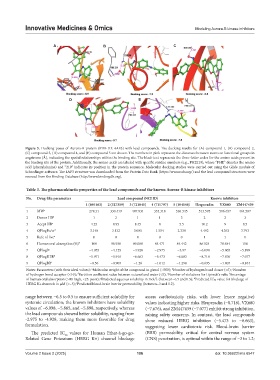
Figure 5. Docking poses of Aurora-B protein (PDB ID: 4AF3) with lead compounds. The docking results for (A) compound 1, (B) compound 2,
(C) compound 3, (D) compound 4, and (E) compound 5 are shown. The numbers in pink represent the distances between atoms or functional groups in
angstroms (Å), indicating the spatial relationships within the binding site. The black text represents the three-letter codes for the amino acids present in
the binding site of the protein. Additionally, the amino acids are labeled with specific residue numbers (e.g., PHE219), where “PHE” denotes the amino
acid (phenylalanine) and “219” indicates its position in the protein sequence. Molecular docking studies were carried out using the Glide module of
Schrodinger software. The 4AF3 structure was downloaded from the Protein Data Bank (https://www.rcsb.org/) and the lead compound structures were
sourced from the Binding Database (http://www.bindingdb.org).
Table 3. The pharmacokinetic properties of the lead compounds and the known Aurora‑B kinase inhibitors
No. Drug‑like parameters Lead compound (NCI ID) Known inhibitors
1 (695163) 2 (327359) 3 (721045) 4 (711797) 5 (104546) Hesperadin VX680 ZM447439
1 MW a 278.31 330.419 447.831 335.318 330.345 513.595 516.657 464.587
2 Donor HB b 1 2 1 1 3 2 2 3
3 Accpt HB c 4.25 4.95 8.45 8 5.5 10.2 9 8.5
4 QPlogPo/w d 3.148 3.132 3.005 1.554 2.338 4.492 4.363 3.793
5 Rule of five e 0 0 0 0 0 1 1 0
6 Human oral absorption (%) f 100 96.956 89.088 84.471 84.442 86.524 78.484 100
7 QPlogS g −4.055 −4.125 −4.928 −2.975 −3.97 −6.098 −5.865 −5.898
8 QPlogHER h −5.971 −5.916 −6.663 −5.473 −6.083 −8.718 −7.676 −7.077
9 QPlogBB i −0.56 −0.909 −1.26 −1.012 −1.298 −0.695 −1.407 −0.844
Notes: Parameters (with their ideal values): Molecular weight of the compound in g/mol (<500); Number of hydrogen bond donor (<5); Number
c
b
a
of hydrogen bond acceptor (<10); Partition coefficient value between octanol and water (<5); Number of violations for Lipinski’s rule; Percentage
e
d
f
of human oral absorption (>80: high, <25: poor); Predicted aqueous solubility in mol/L (between−6.5 and 0.5); Predicted IC50 value for blockage of
g
h
HERG K+channels in µM (<−5); Predicted blood-brain barrier permeability, (between−3 and 1.2).
i
range between −6.5 to 0.5 to ensure sufficient solubility for assess cardiotoxicity risks, with lower (more negative)
systemic circulation; the known inhibitors have solubility values indicating higher risks. Hesperadin (−8.718), VX680
values of −6.098, −5.865, and −5.898, respectively, whereas (−7.676), and ZM447439 (−7.077) exhibit strong inhibition,
the lead compounds showed better solubility, ranging from raising safety concerns. In contrast, the lead compounds
-2.975 to -4.928, making them more favorable for drug show reduced HERG inhibition (−5.473 to −6.663),
formulation. suggesting lower cardiotoxic risk. Blood-brain barrier
The predicted IC values for Human Ether-à-go-go- (BBB) permeability, critical for central nervous system
50
Related Gene Potassium (HERG K+) channel blockage (CNS) penetration, is optimal within the range of −3 to 1.2;
Volume 2 Issue 2 (2025) 106 doi: 10.36922/imo.6547