
Page 113 - IMO-2-2
P. 113
Innovative Medicines & Omics Modeling Aurora-B kinase inhibitors
the values for the known inhibitors range from −0.695 to While compounds 1 and 3 showed minimal fluctuations,
−1.407, suggesting moderate BBB permeability; the lead indicating strong binding affinity and structural integrity,
compounds show comparable values between −0.56 and compound 4 displayed transient instability before attaining
−1.298, indicating their potential CNS activity for therapeutic a stable conformation by the end of the 100 ns simulation
applications. Overall, the pharmacokinetic evaluation reveals period. To further elucidate the binding mechanisms
that all five lead compounds exhibit favorable drug-likeness at the atomic level, various intermolecular interactions
properties with no violations of Lipinski’s rule. Their optimal such as hydrogen bonding, hydrophobic contacts, ionic
molecular weights, hydrogen bonding characteristics, log P interactions, salt bridges, and π-π stacking were extensively
values, high absorption rates, superior solubility, reduced analyzed. These interactions play a fundamental role in
cardiotoxicity risks, and comparable BBB permeability determining ligand affinity and stability within the binding
suggest superior pharmacokinetic profiles compared to the pocket. Hydrogen bonding was identified as a key stabilizing
known inhibitors, reinforcing their potential as promising factor, with multiple direct and water-mediated hydrogen
Aurora-B kinase inhibitors. bonds contributing to the persistence of the protein-
3.4. MD simulations ligand complexes. In addition, π-π stacking and π-cation
interactions provided additional stabilization by facilitating
MD simulations were conducted to evaluate the stability, optimal ligand orientation within the active site. Water
flexibility, and binding interactions of the five lead compounds bridge interactions highlighted the role of solvent molecules
within the active site of Aurora-B kinase over a 100 ns in mediating ligand-protein interactions, further enhancing
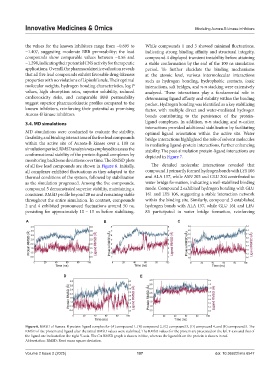
simulation period. RMSD analysis was employed to assess the stability. The post-simulation protein-ligand interactions are
conformational stability of the protein-ligand complexes by depicted in Figure 7.
monitoring backbone deviations over time. The RMSD plots
of all five lead compounds are shown in Figure 6. Initially, The detailed molecular interactions revealed that
all complexes exhibited fluctuations as they adapted to the compound 1 primarily formed hydrogen bonds with LYS 106
thermal conditions of the system, followed by stabilization and ALA 157, while ASN 205 and GLU 204 contributed to
as the simulation progressed. Among the five compounds, water bridge formation, indicating a well-stabilized binding
compound 5 demonstrated superior stability, maintaining a mode. Compound 2 exhibited hydrogen bonding with GLU
consistent RMSD profile beyond 20 ns and remaining stable 161 and LYS 106, suggesting a stable interaction network
throughout the entire simulation. In contrast, compounds within the binding site. Similarly, compound 3 established
2 and 4 exhibited pronounced fluctuations around 50 ns, hydrogen bonds with ALA 157, while GLU 161 and LEU
persisting for approximately 10 – 15 ns before stabilizing. 83 participated in water bridge formation, reinforcing
A B C
D E
Figure 6. RMSD of Aurora-B protein-ligand complex for (A) compound 1, (B) compound 2, (C) compound 3, (D) compound 4, and (E) compound 5. The
RMSD of the protein and ligand after the initial RMSD values were stabilized. The RMSD values for the protein are presented on the left Y-axis and that of
the ligand are indicated on the right Y-axis. The Cα RMSD graph is shown in blue, whereas the ligand fit on the protein is shown in red.
Abbreviation: RMSD: Root mean square deviation.
Volume 2 Issue 2 (2025) 107 doi: 10.36922/imo.6547