
Page 125 - ITPS-7-2
P. 125
INNOSC Theranostics and
Pharmacological Sciences PI3K-α inhibitors for cancer immunotherapy
value of 0.8825, held a stronger correlation with the model protein-ligand complex. On the other hand, hydrogen
82
than other PLS factors, even as PLS factor 3 ranked next. bond acceptor interactions illustrate how ligands accept
However, the rank which the degree of correlation is electrons from a protein donor, stabilize the complex, and
depicted in the following trend: enhance ligand recognition within the protein, in which
83
Pearson−r: PLS factor 4 ⟹ PLS factor 3 ⟹ PLS factor 2 the hydrogen bond paring influences shifts in pKa values
⟹ PLS factor 1 of interacting groups and also affects charge distribution
and electrostatic potential. 84
The table can be used to compare different models with
different numbers of factors and select the best one based on In conjunction with Table 3, the visualization of
the given statistical criteria. However, a good QSAR model the interactive contributions of the different Gaussian
should not only have a high R value but also have high descriptors in the context of PLS factor 3 under study is
2
predictive power, robustness, interpretability, applicability, graphically presented in Figure 10.
etc. It is logical to choose a model that has high R , Q , and 3.6. Rational design of a new ligand
2]
2
Pearson-r, and a low RMSE and p-value, while avoiding
2
overfitting (indicated by a large gap between R and R CV 3.6.1. Skeletal modifications
2
or a high R Scr) and instability (indicated by a low stability). Medicinal chemistry continues to be impacted by
2
It is inferred from Table 2 that PLS factors 4 and 3 were innovative in silico methods, especially at the drug
the best performers among other PLS factors. To compare, discovery stage using QSAR models. In this study, we
PLS factor 4 performed better than PLS factor 3 in terms attempted to design a new compound with enhanced
of fit, significance, accuracy, reliability, and correlation, binding affinity and specificity by enacting the desired
but worse in terms of variation, prediction, generalization, chemical transformations on a reference ligand in a concise
and stability. Based on these critical criteria, PLS factor 3 and chemospecific fashion. The concept of “molecular
was considered the optimal PLS factor, which offered the editing” involves building onto, modifying, or pruning
safest approach that accounted for model performance and molecules atom by atom, utilizing transformations that are
quality. adequately mild and selective for application in the later
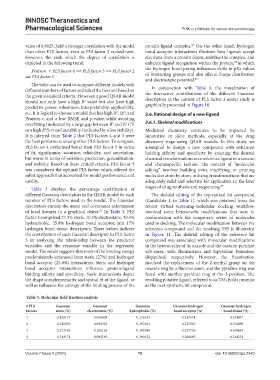
Table 3 displays the percentage contribution of stages of drug synthesis and sequencing. 85
different Gaussian descriptors in the QSAR model for each The skeletal editing of the top-ranked hit compound
number of PLS factors used in the model. The Gaussian (Candidate 1, in Table 1), which was obtained from the
descriptors encode the mean and covariance information robust virtual screening-molecular docking workflow,
of local features in a graphical object. In Table 3, PLS involved some heterocyclic modifications that were in
81
factor 3 comprised 27.3% steric, 10.5% electrostatic, 19.4% conformation with the congeneric series of molecules
hydrophobic, 25.8% hydrogen bond acceptor, and 17% used in docking. The molecular modification between the
hydrogen bond donor descriptors. These values indicate reference compound and the resulting T85 is illustrated
the contribution of each Gaussian descriptor to PLS factor in Figure 11. The skeletal editing of the reference hit
3 in analyzing the relationship between the predictor compound was associated with molecular modifications
variables and the response variable in the regression in the heterocycles of its oxazole and the oxetane-pyridine
model. The result suggests that most of the binding energy sub-cores, with fluorination and bipyridine formation
predominantly emanated from steric (27%) and hydrogen dispatched, respectively. However, the fluorination
bond acceptor (25.8%) interactions. Steric and hydrogen involved the replacement of the 2-methyl group on the
bond acceptor interactions influence protein-ligand oxazole ring by a fluorine atom, and the pyridine ring was
binding affinity and specificity. Steric interactions depict fused with another pyridine ring at the 3-position. The
the shape complementarity and spatial fit of the ligand, as resulting putative ligand, referred to as T85, holds promise
well as influence the entropy of the binding process of the as the next synthetic hit compound.
Table 3. Molecular field fraction analysis
# PLS Gaussian Gaussian Gaussian Gaussian hydrogen Gaussian hydrogen
factors steric (%) electrostatic (%) hydrophobic (%) bond acceptor (%) bond donor (%)
1 0.428119 0.056828 0.172533 0.217674 0.124847
2 0.315070 0.093522 0.197463 0.237846 0.156099
3 0.273183 0.105146 0.194088 0.257736 0.169848
4 0.312171 0.093195 0.190332 0.260085 0.144218
Volume 7 Issue 2 (2024) 15 doi: 10.36922/itps.2340