
Page 123 - ITPS-7-2
P. 123
INNOSC Theranostics and
Pharmacological Sciences PI3K-α inhibitors for cancer immunotherapy
model. While the force field model is similar to the The coefficient of determination (R ) is the measure of
2
comparative molecular field analysis (CoMFA) models, the the proportion of variance in the observed activity that is
2
Gaussian model is similar to the comparative molecular explained by the model. Statistically, the R value ranges
76
structure analysis (CoMSIA). However, the hybrid model from 0 to 1, with 1 indicating the excellent explanatory
is built on the OPLS-3e force field, which requires a set of power of a model. Furthermore, a high R value indicates a
2
aligned compounds in a 3D space with known activities for good fit of the model data. Hence, in Table 2, the hierarchy
predictive operation. of importance in the value of R across each PLS factor is
2
depicted in the following trend:
Table 2 summarizes the performance of the robust
2
field-based 3D-QSAR model, organized into four different R : PLS factor 4 ⟹ PLS factor 3 ⟹ PLS factor 2 ⟹ PLS
partial least squares (PLS) regression sub-models. Each row factor 1
illustrates the application of special multivariate statistical Emphatically, it is important to note that a high value
analysis routines – PLS factors – used in building the model. of R does not necessarily translate to a better model when
2
The PLS factors are linear combinations of the original interpreting the R statistic of a QSAR model for novel drug
2
predator variables that are used to fit a linear regression discoveries, since a high R may be achieved by overfitting
2
model. The number of PLS factors or latent variables was the model to the training data. Furthermore, it does not
employed to extract the most relevant information from imply a causality nor provide a mechanistic interpretation
the molecular descriptors and the biological activity data of the QSAR model, 77,78 which is often misconceived
of the inhibitors. Based on the pIC as the activity property among many researchers.
50
of the inhibitory compounds, the model performance was
validated across several statistical indices, such as standard The coefficient of determination obtained by cross-
2
deviation (SD), coefficient of determination (R ), R cross- validation (R cross-validation) is a statistical method
2
2
validation for the training set, R scramble (R Scr), model used to assess the predictive performance of the model on
2
2
2
stability, F-value, p-value, root mean square error (RMSE), new data. In addition, the R cross-validation values were
cross-validated coefficient of determination (Q ) for the computed from the predictions obtained by a leave-one-
2
test set, and the Pearson-r correlation with the test set of out (LOO) approach as a measure of the predictability of
the model. Hence, the PLS factors are compared with the the CoMFA mode. According to the CoMFA approach,
best performer selected to depict the field-based 3D-QSAR changes in the biological activities or binding affinities of
model. sample compounds correlate with the variations in the
steric and electrostatic fields of the molecules since drug-
The SD is a descriptive statistic used in the majority of receptor interactions are typically non-covalent. In a typical
clinical and experimental studies, and it illustrates how CoMFA procedure, the steric and electrostatic fields around
the mean represents sample data while also evaluating the each molecule under study are sampled using probe atoms,
variation in a dataset that follows a normal distribution. 73-75 typically sp3 carbon atoms with +1 charge, on a rectangular
A low SD indicates more stable and consistent sample data grid that includes the structurally aligned molecules. The
79
whose values are close to the mean, while a high standard R cross-validation value greater than 0.3 is considered
2
deviation indicates that the values are spread out (scattered) significant. However, in Table 2, only PLS factor 1 deviated
over a wide range, away from the mean. Thus, as shown in from significance in that its R cross-validation value was
2
Table 2, the order of significance of the SD for the four PLS 0.2157. Hence, the following trend depicted the order of
factors is illustrated by the following trend: significance among the four PLS factors:
SD: PLS factor 4 ⟹ PLS factor 3 ⟹ PLS factor 2 ⟹ PLS R CV: PLS factor 4 ⟹ PLS factor 3 ⟹ PLS factor 2 ⟹
2
factor 1 PLS factor 1
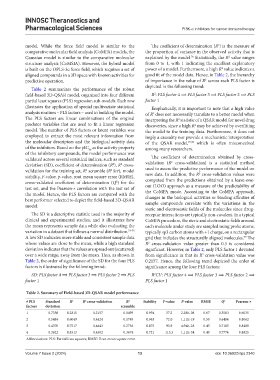
Table 2. Summary of Field‑based 3D‑QSAR model performance
# PLS Standard R 2 R cross‑validation R Stability F‑value P‑value RMSE Q 2 Pearson‑r
2
2
factors deviation scramble
1 0.7356 0.2815 0.2157 0.0499 0.994 37.2 2.28E-08 0.67 0.3583 0.6035
2 0.5484 0.6049 0.4424 0.1749 0.963 72.0 1.11E-19 0.50 0.6486 0.8062
3 0.4370 0.7517 0.4643 0.2736 0.875 93.9 4.94E-28 0.45 0.7185 0.8488
4 0.3622 0.8313 0.4502 0.3674 0.721 113.3 1.11E-34 0.40 0.7776 0.8825
Abbreviations: PLS: Partial least squares; RMSE: Root mean square error.
Volume 7 Issue 2 (2024) 13 doi: 10.36922/itps.2340