
Page 65 - ITPS-8-2
P. 65
INNOSC Theranostics and
Pharmacological Sciences Preclinical study of GBpoietin biosimilar
A B
C D
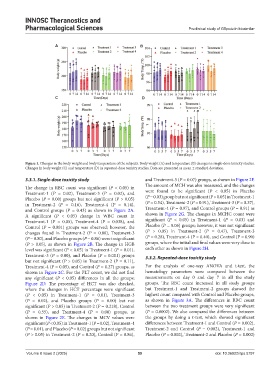
Figure 1. Changes in the body weight and body temperature of the subjects. Body weight (A) and temperature (B) changes in single-dose toxicity studies.
Changes in body weight (C) and temperature (D) in repeated-dose toxicity studies. Data are presented as mean ± standard deviation.
3.3.1. Single-dose toxicity study and Treatment-3 (P = 0.07) groups, as shown in Figure 2F.
The change in RBC count was significant (P < 0.05) in The amount of MCH was also measured, and the changes
Treatment-1 (P = 0.02), Treatment-3 (P = 0.02), and were found to be significant (P < 0.05) in Placebo
Placebo (P = 0.00) groups but not significant (P > 0.05) (P = 0.03) group but not significant (P > 0.05) in Treatment-1
in Treatment-2 (P = 0.16), Treatment-4 (P = 0.14), (P = 0.54), Treatment-2 (P = 0.91), Treatment-3 (P = 0.37),
and Control groups (P = 0.43) as shown in Figure 2A. Treatment-4 (P = 0.97), and Control groups (P = 0.91) as
A significant (P < 0.05) change in WBC count in shown in Figure 2G. The changes in MCHC count were
Treatment-1 (P = 0.05), Treatment-4 (P = 0.038), and significant (P < 0.05) in Treatment-1 (P = 0.03) and
Control (P = 0.001) groups was observed; however, the Placebo (P = 0.06) groups; however, it was not significant
changes found in Treatment-2 (P = 0.80), Treatment-3 (P > 0.05) in Treatment-2 (P = 0.47), Treatment-3
(P = 0.80), and Placebo groups (P = 0.86) were insignificant (P = 0.28), Treatment-4 (P = 0.40), and Control (P = 0.90)
(P > 0.05), as shown in Figure 2B. The change in HGB groups, where the initial and final values were very close to
level was significant (P < 0.05) in Treatment-1 (P = 0.01), each other as shown in Figure 2H.
Treatment-3 (P = 0.00), and Placebo (P = 0.001) groups 3.3.2. Repeated-dose toxicity study
but not significant (P > 0.05) in Treatment-2 (P = 0.11),
Treatment-4 (P = 0.05), and Control (P = 0.27) groups, as For the analysis of one-way ANOVA and t-test, the
shown in Figure 2C. For the PLT count, we did not find hematology parameters were compared between the
any significant (P < 0.05) differences in all the groups; measurements on day 0 and day 7 in all the study
Figure 2D. The percentage of HCT was also checked, groups. The RBC count increased in all study groups
where the changes in HCT percentage were significant but Treatment-1 and Treatment-2 groups showed the
(P < 0.05) in Treatment-1 (P = 0.01), Treatment-3 highest count compared with Control and Placebo groups,
(P = 0.02), and Placebo groups (P = 0.00) but not as shown in Figure 3A. The differences in RBC count
significant (P > 0.05) in Treatment-2 (P = 0.218), Control between the two treatment groups were very significant
(P = 0.55), and Treatment-4 (P = 0.08) groups, as (P = 0.0002). We also compared the differences between
shown in Figure 2E. The changes in MCV values were the groups by doing a t-test, which showed significant
significant (P < 0.05) in Treatment-1 (P = 0.02), Treatment-4 differences between Treatment-1 and Control (P = 0.002),
(P = 0.01), and Placebo (P = 0.02) groups but not significant Treatment-2 and Control (P = 0.002), Treatment-1 and
(P > 0.05) in Treatment-2 (P = 0.20), Control (P = 0.86), Placebo (P = 0.002), Treatment-2 and Placebo (P = 0.002)
Volume 8 Issue 2 (2025) 59 doi: 10.36922/itps.5797