
Page 68 - ITPS-8-2
P. 68
INNOSC Theranostics and
Pharmacological Sciences Preclinical study of GBpoietin biosimilar
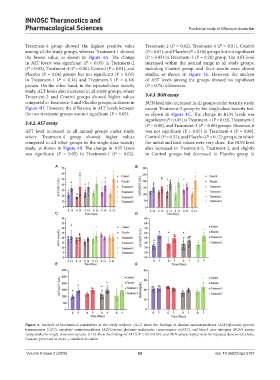
Treatment-4 group showed the highest positive value Treatment-2 (P = 0.02), Treatment-4 (P = 0.01), Control
among all the study groups, whereas Treatment-1 showed (P = 0.01), and Placebo (P = 0.06) groups but not significant
the lowest value, as shown in Figure 4A. The change (P > 0.05) in Treatment-3 (P = 0.28) group. The AST level
in ALT levels was significant (P < 0.05) in Treatment-2 increased within the normal range in all study groups,
(P = 0.03), Treatment-4 (P = 0.00), Control (P = 0.01), and including Control group, and their results were almost
Placebo (P = 0.06) groups but not significant (P > 0.05) similar, as shown in Figure 4E. However, the analysis
in Treatment-1 (P = 0.14) and Treatment-3 (P = 0.10) of AST levels among the groups showed no significant
groups. On the other hand, in the repeated-dose toxicity (P = 0.76) differences.
study, ALT levels also increased in all study groups, where
Treatment-2 and Control groups showed higher values 3.4.3. BUN assay
compared to Treatment-1 and Placebo groups, as shown in BUN level also increased in all groups under toxicity study,
Figure 4D. However, the difference in ALT levels between except Treatment-3 group in the single-dose toxicity test,
the two treatment groups was not significant (P < 0.05). as shown in Figure 4C. The change in BUN levels was
significant (P < 0.05) in Treatment-1 (P = 0.03), Treatment-2
3.4.2. AST assay (P = 0.00), and Treatment-3 (P = 0.00) groups. However, it
AST level increased in all animal groups under study, was not significant (P > 0.05) in Treatment-4 (P = 0.80),
where Treatment-4 group showed higher values Control (P = 0.31), and Placebo (P = 0.12) groups, in which
compared to all other groups in the single-dose toxicity the initial and final values were very close. The BUN level
study, as shown in Figure 4B. The change in AST levels also increased in Treatment-1, Treatment-2, and slightly
was significant (P < 0.05) in Treatment-1 (P = 0.02), in Control groups but decreased in Placebo group in
A B
C D
E F
Figure 4. Analysis of biochemical parameters of the study subjects. (A-C) show the findings of alanine aminotransferase (ALT)/glutamic pyruvic
transaminase (GPT), aspartate aminotransferase (AST)/serum glutamic-oxaloacetic transaminase (sGOT), and blood urea nitrogen (BUN) assays,
respectively, for single-dose toxicity tests. (D-F) show the findings of ALT/GPT, AST/sGOT, and BUN assays, respectively, for repeated-dose toxicity tests.
Data are presented as mean ± standard deviation.
Volume 8 Issue 2 (2025) 62 doi: 10.36922/itps.5797