
Page 66 - ITPS-8-2
P. 66
INNOSC Theranostics and
Pharmacological Sciences Preclinical study of GBpoietin biosimilar
A B
C D
E F
G H
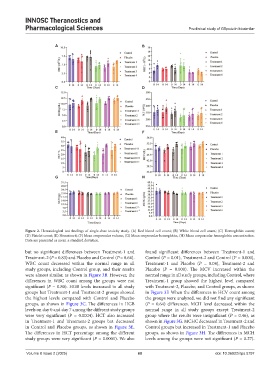
Figure 2. Hematological test findings of single-dose toxicity study. (A) Red blood cell count; (B) White blood cell count; (C) Hemoglobin count;
(D) Platelet count; (E) Hematocrit; (F) Mean corpuscular volume; (G) Mean corpuscular hemoglobin; (H) Mean corpuscular hemoglobin concentration.
Data are presented as mean ± standard deviation.
but no significant differences between Treatment-1 and found significant differences between Treatment-1 and
Treatment-2 (P = 0.83) and Placebo and Control (P = 0.64). Control (P = 0.01), Treatment-2 and Control (P = 0.000),
WBC count decreased within the normal range in all Treatment-1 and Placebo (P = 0.04), Treatment-2 and
study groups, including Control group, and their results Placebo (P = 0.000). The MCV increased within the
were almost similar, as shown in Figure 3B. However, the normal range in all study groups, including Control, where
differences in WBC count among the groups were not Treatment-1 group showed the highest level compared
significant (P = 0.80). HGB levels increased in all study with Treatment-2, Placebo, and Control groups, as shown
groups but Treatment-1 and Treatment-2 groups showed in Figure 3F. When the differences in HCV count among
the highest levels compared with Control and Placebo the groups were analyzed, we did not find any significant
groups, as shown in Figure 3C. The differences in HGB (P = 0.64) differences. MCH level decreased within the
levels on day 0 and day 7 among the different study groups normal range in all study groups except Treatment-2
were very significant (P = 0.0004). HCT also increased group where the results were insignificant (P = 0.46), as
in Treatment-1 and Treatment-2 groups but decreased shown in Figure 3G. MCHC decreased in Treatment-2 and
in Control and Placebo groups, as shown in Figure 3E. Control groups but increased in Treatment-1 and Placebo
The differences in HCT percentage among the different groups, as shown in Figure 3H. The differences in MCH
study groups were very significant (P = 0.0001). We also levels among the groups were not significant (P = 0.27).
Volume 8 Issue 2 (2025) 60 doi: 10.36922/itps.5797